The global small- and mid-sized (capitalisation or cap) asset class (SMID) has strongly outperformed large-cap stocks over the long term, and while market leadership ebbs and flows over shorter periods, SMID appears well-positioned to potentially assume a leadership role over the next few years.
Exhibit 1: Global small/mid-cap stocks have strongly outperformed large-caps over time
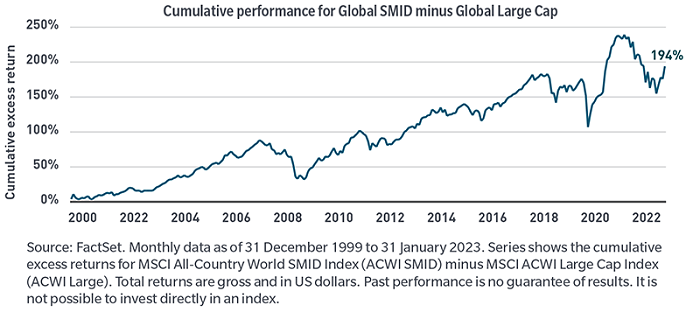
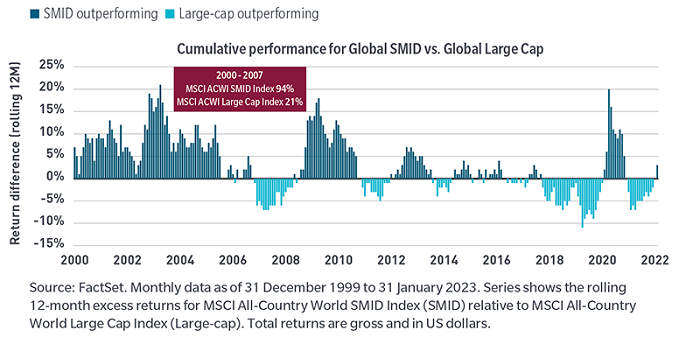
Exhibit 2: While leadership has tended to rotate every few years
Why consider investing now?
In our view, the opportunity set for small- and mid-caps appears particularly attractive. Referring back to Exhibit 2, from the end of the dot-com-era (early 2000s) until the early days of the GFC in 2008, global small- and mid-cap stocks significantly outperformed relative to their large-cap counterparts. The MSCI ACWI (All Countries World) SMID Index returning 94% vs. the MSCI ACWI Large Cap Index return of just 21%.
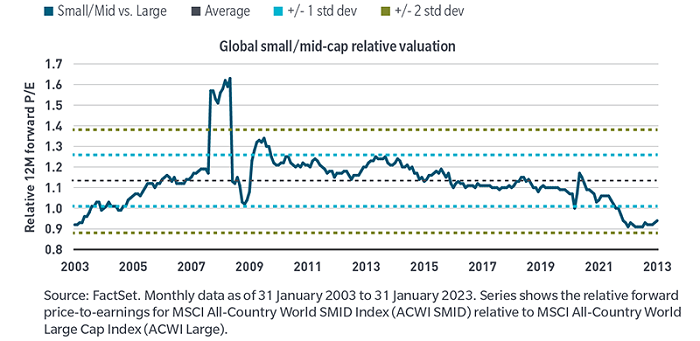
And while no two periods are perfectly alike, there are similarities between that roughly eight-year period from the early to late 2000s to today’s environment. First, valuations offer investors a buying opportunity not seen in decades, as valuations are close to two standard deviations 'cheap' relative to large caps.
Exhibit 3: Global small/mid-cap valuations at multi-decade lows relative to large-caps
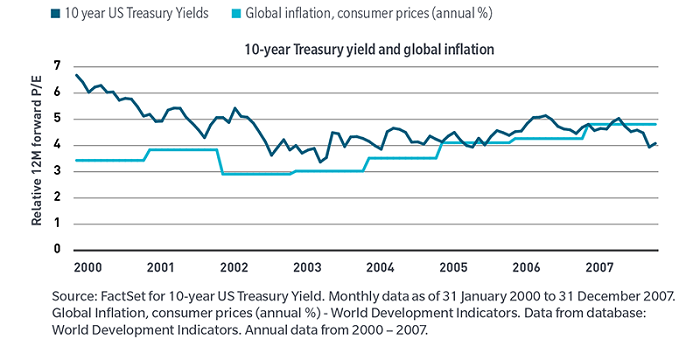
Second, inflation and interest rates during the run up to the GFC are more aligned with today’s reality versus what we witnessed in the decade following the GFC to the culmination of the pandemic. At that time, inflation was essentially non-existent and globally yields were either close to zero or even in negative territory. In fact, from 2000 through the end of 2007, the 10-year US Treasury yield averaged 4.7% and global inflation averaged 3.7% (Exhibit 4). That period is not all that different from today.
Exhibit 4: 2000 – 2007: Inflation and interest rates more reminiscent of today’s environment
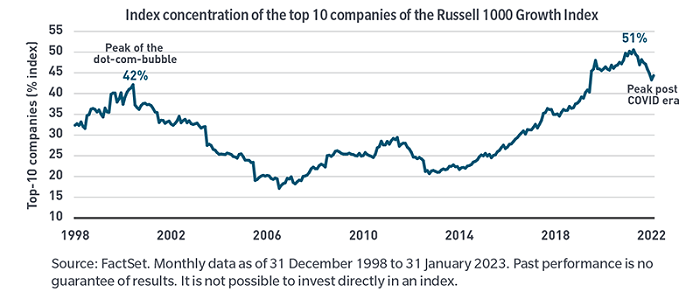
Markets during the pre-GFC period also witnessed a dramatic sell-off as the dot.com bubble burst. The high-flying technology stocks with unattainable growth expectations - think irrational exuberance - of that period are analogous to the meme stocks of today. Looking at the concentration of the Russell 1000 Growth Index at the end of 2001, similarities are again apparent (Exhibit 5).
Exhibit 5: A handful of large-cap stocks dominated performance then and now
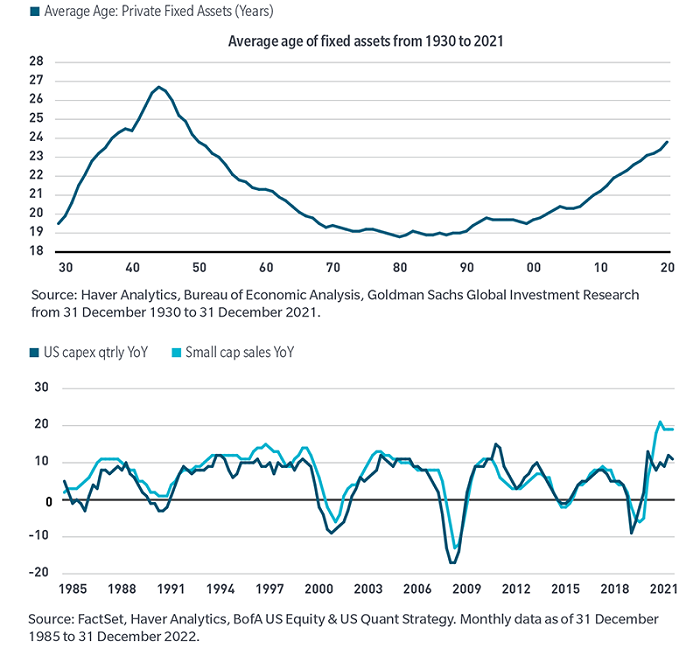
Future spending trends may benefit a wider cohort of sectors and industries, including small- and mid-cap stocks, rather than just the mega-cap technology companies that garnered the dominant share of spending in the past decade. Specific to SMID, spending trends may be driven by a 70-year high in the average age of fixed assets (see Exhibit 6).
Further, a move to localisation as governments and companies around the world onshore supply chains to improve their supply chain resilience could provide a tail-wind. The local nature of small- and mid-cap companies could work in their favour while large-cap company margins may come under pressure as benefits of globalisation (lower taxes and labour costs) subside as onshoring gears up.
Exhibit 6: Small/mid-caps may benefit as aging fixed assets may drive capex which has been highly correlated with sales growth
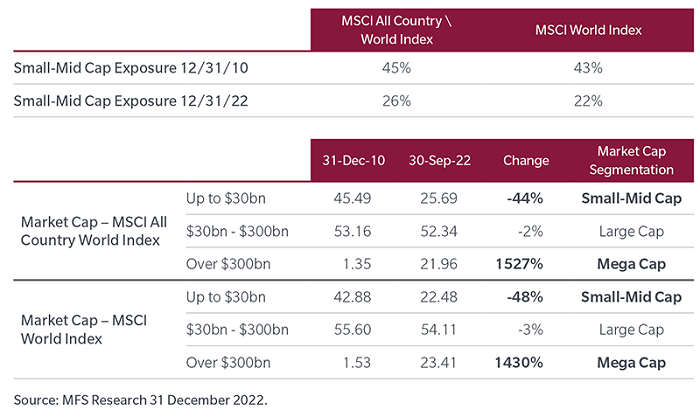
The strong performance of a handful of major US technology stocks during the past decade means today’s global investor is significantly less able to gain exposure to small- and mid-cap stocks through the traditional standard global benchmark allocation. In our view, the dominance of the most influential large-cap stocks can be better appreciated when viewed from the perspective of market-capitalisation buckets, as illustrated in Exhibit 7, where exposure to small- and mid-cap stocks in the MSCI World Index has declined from 43% of that index in 2010 to only 22%.
We witness an almost identical trend in the MSCI All Country Index, where small- and mid-cap stocks declined from 46% of the index to just 26%.
Exhibit 7: Changing landscape of global large cap benchmarks
Why active management?
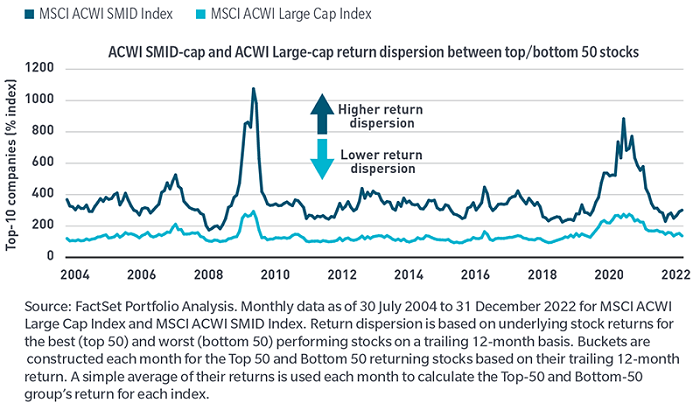
We believe this asset class may present more outperfromance (alpha) opportunity for active managers. The universe receives substantially less research coverage by sell-side analysts compared with other asset classes, particularly large-cap stocks (Exhibit 8). The return dispersion for these stocks is more than double that of large-caps (Exhibit 9). Both of these factors present ample opportunity for active managers with the experience and deep research resources to identify attractive stock opportunities.
Exhibit 8: Lack of research coverage may offer opportunity for active managers with a global research platform
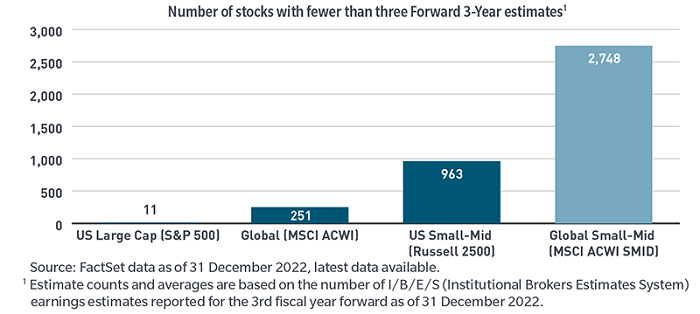
Exhibit 9: Higher dispersion for global small/mid-cap may present more alpha opportunity for active managers
Nicholas J. Paul, CFA is an Institutional Portfolio Manager at MFS Investment Management. This article is for general informational purposes only and should not be considered investment advice or a recommendation to invest in any security or to adopt any investment strategy. Comments, opinions and analysis are rendered as of the date given and may change without notice due to market conditions and other factors. This article is issued in Australia by MFS International Australia Pty Ltd (ABN 68 607 579 537, AFSL 485343), a sponsor of Firstlinks.
For more articles and papers from MFS, please click here.
Unless otherwise indicated, logos and product and service names are trademarks of MFS® and its affiliates and may be registered in certain countries.