At the start of this year, fund managers and individual investors piled back into bonds. Suddenly, bonds had a decent yield. And they’d just endured their worst annual performance on record, which surely meant reversion to the mean would see them bounce back.
Yet that hasn’t happened. Bonds are possibly heading for a third straight year of losses, which is unprecedented over the past 100 years.
What’s surprising is that investors are so surprised by these events. After all, what happened before this period was itself unprecedented, with bond yields turning negative in many countries, something that has rarely happened. A snapback from these extraordinarily low yields was inevitable.
And if you zoom out from the current noise, bond market cycles tend to last 30-40 years. Bond yields came down for 39 years from 1981 to 2020. 2020 likely marked the beginning of a long cycle of rising yields. Commentators now talk about yields and rates being ‘higher for longer’, meaning perhaps higher for another 12 months. What they should really be saying is that yields could be going higher for a lot longer, if history is any guide.
It’s a bond bloodbath
If you thought bond were due for better times this year, you weren’t alone. Fund manager expectations for lower bond yields hit 20-year highs in April this year, and still hover near those highs.
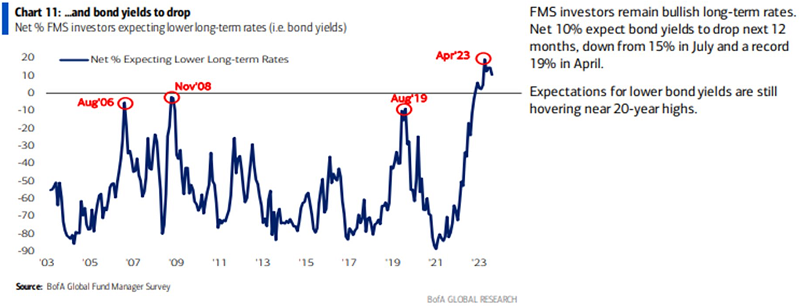
It hasn’t turned out well for many of these managers with bonds again in the red this year. If the trend continues and bonds finish down again this year, it would be the third consecutive year of losses, something that hasn’t happened over the past century.
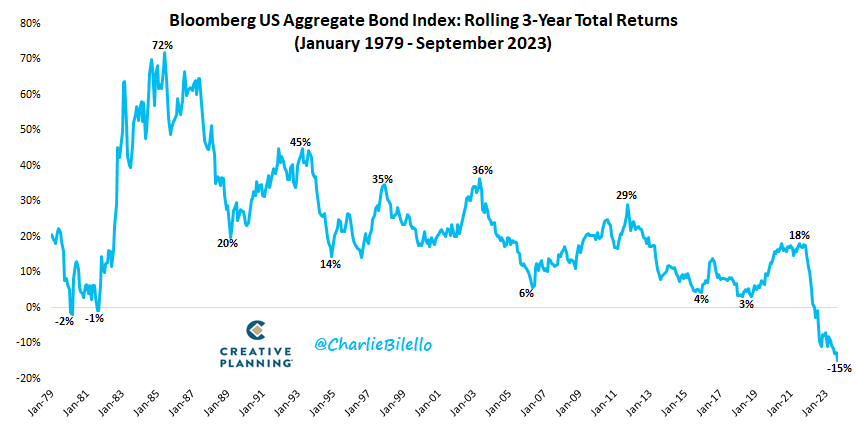
And it's the worst three year stretch for US aggregate bonds on record.
Why are bond yields continuing to rise?
As noted in a recent article by Morningstar’s Tom Lauricella, there are several factors behind the continuing rise in bond yields:
US economic strength. While America is slowing somewhat, it’s nowhere near as much as economists expected 12 months ago. And the economy appears to have picked up this quarter. The Federal Reserve Bank of Atlanta’s GDPNow measure—measuring the current pace of gross domestic product growth—suggests third-quarter GDP will be 4.9%, up from the 2.1% in the second quarter. If right, it would also be the strongest rate of quarterly GDP growth since the end of 2021. The US job market is especially strong, with recent initial job claims coming in at 201,000, a very low number.
Central bank expectations for fewer interest rate cuts in 2024. Given the economic strength, it’s no surprise that the US Federal Reserve and other central banks are starting to talk about fewer interest rate cuts for next year. Recently released Fed forecasts show the funds rate at 5.1% at year-end 2024, which would imply a half-percentage-point cut at most.
US net debt issuance. At the end of July, bond investors were caught off-guard when the Treasury announced a significantly larger need to raise money than what they expected. The US government now expects to raise a net $1.007 trillion through bond sales in the third quarter—the largest-ever cash raise during a third quarter. With this announcement, the supply/demand dynamic of the bond market was thrown off balance as bond dealers and investors factored in the additional amount of bonds entering the market while the fundamental backdrop was worsening.
I would also add other factors:
Sticky inflation. In the US and elsewhere, inflation isn’t coming down as quickly as many had expected. In fact, it’s going up again in some countries, such as Australia. Here, the annual headline consumer price index climbed to 5.2% in August from 4.9% a month earlier.
Excess savings being worked through. What’s continuing to be underestimated is the enduring impact from money printing by central banks during Covid. The banks printed US$8 trillion, financing roughly the same amount of government spending, and directly monetizing the largest peacetime deficits in US history. Sticky inflation is the hangover from this money printing.
A 40-year bond market cycle?
While everyone focuses on the short-term rise in bond yields, it pays to put them into context.
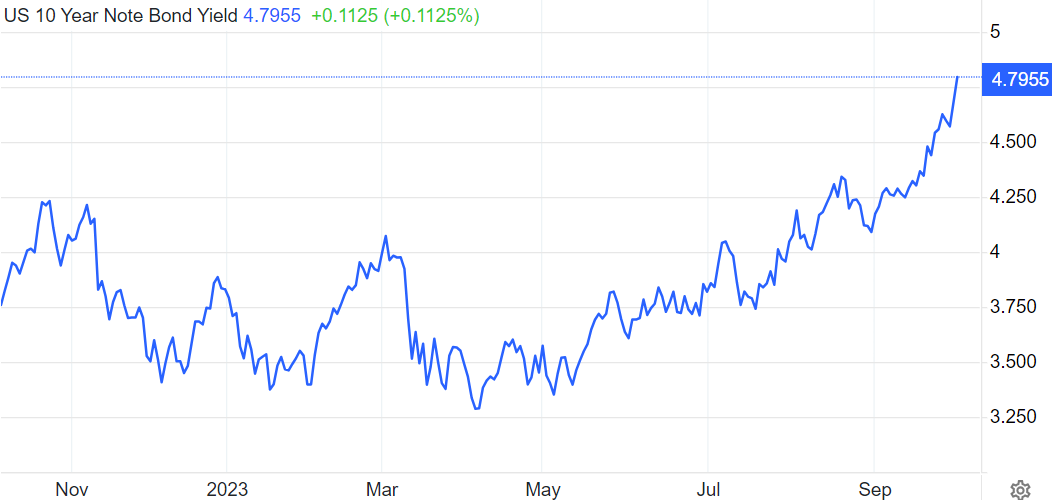
Source: Trading Economics
There have been three long-term bond market cycles for US government bonds over the past 100 years. The first cycle started after World War One. Bond yields peaked just above 5% in 1921. Due to deflation from the Great Depression and a cap on rates to finance World War II, yields dropped to 2.48% in 1954. That ended a 33-year bull market in bonds.
From 1954, the second cycle began. Though yields didn’t really pick up until the 1960s when inflation started to rise, partly due to Lyndon Johnson’s government spending on an ambitious domestic agenda and the Vietnam War. Inflation and bond yields went even higher in the 1970s before Fed Chairman Paul Volcker hiked rates above 20% to squash inflation in the early 1980s. That ended the bond bear market of 37 years.
The third cycle started in 1981 with US 10-year bond yields close to 16%. From that high point, yields fell to just 0.5% in mid-2020. A 39-year bull market for the ages, helped by deflationary forces including globalization, China’s entry into the World Trade Organisation in 2001, favourable demographics, among other factors.
It’s likely 2020 marked the start of a new bond market cycle. Whether this one is a long-lasting as those previously remains to be seen. There are no scientific laws to suggest that market cycles should last 30-40 years. Rather, they’re a historical pattern that we should pay attention too.
It could be a volatile period
If we have entered another long-term cycle of rising bond yields, it doesn’t mean that yields will continue to rise in a straight line. Far from it.
During the last major spike in inflation during the 1970s, there was extreme volatility in inflation, interest rates, and bond yields.
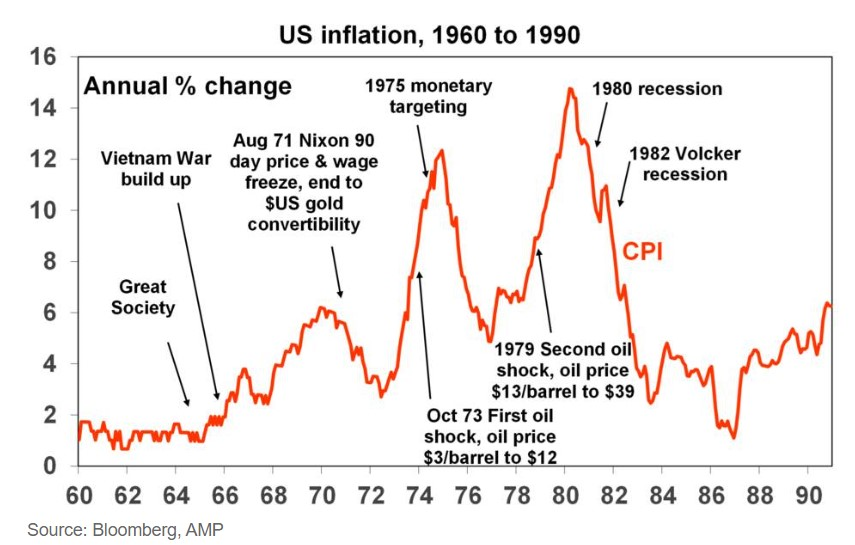
From the mid-1960s, US inflation went from below 2% to more than 6% in 1971. Then it went down again as President Nixon announced a 90-day price and wage freeze, and an end to US dollar-gold convertibility. Then in 1973, there was the first oil shock which drove oil prices from US$3 a barrel to US$12 a barrel. After monetary tightening in 1975, inflation again fell sharply, before a second oil shock in 1979 sent inflation flying again.
It was a similar story in Australia.
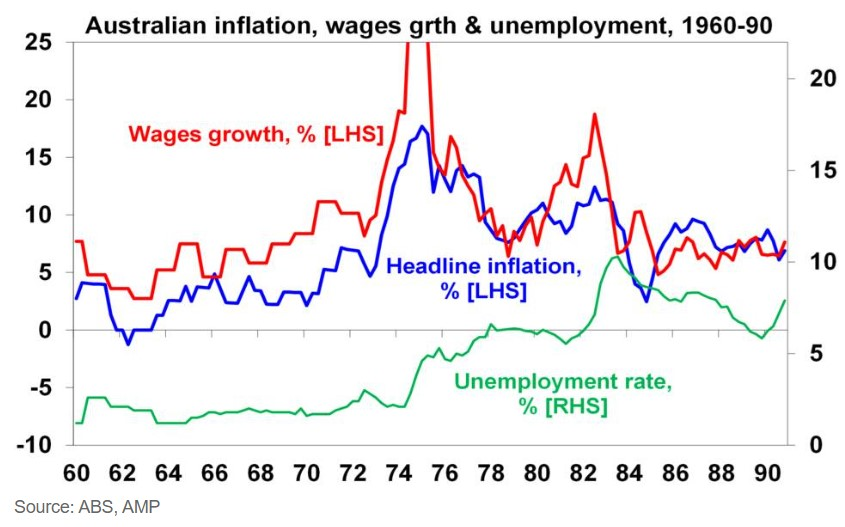
There wasn’t one inflationary cycle in the 1970s. The period saw inflation turn to deflation and back again very quickly. It was a stop-start cycle.
When inflation came sharply down, central banks dropped rates and printed money to prevent deflation. And when inflation spiked again, they slammed on the monetary brakes to bring it down again. But it took over a decade for them to get inflation under control.
The silver lining in inflation
Believe it or not, inflation can serve a purpose. It’s a way to correct economic imbalances. It’s a painful way but can be the only option if governments and central banks don’t take action to correct unsustainable imbalances built up over many years.
Currently, governments and individuals have taken on an enormous pile of debt, and one way to reduce that debt is for interest rates to be kept below the rate of inflation for a period of time – otherwise known as financial repression. It’s what happened post-World War Two and it could well be happening now.
What it means for your portfolio
Noone knows what the future holds. If history is a guide though, we could be three years into a multi-decade bear market in bonds.
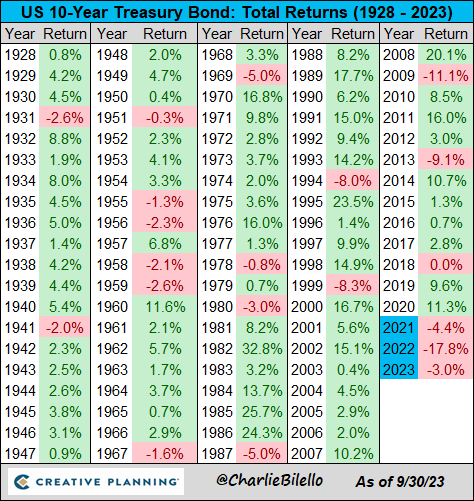
What does that mean for your portfolio? It doesn’t mean that bonds won’t improve from here. Three down years for any asset class is rare, and when they happen, they usually result in a sharp, short-term bounce, as table 7.9 below shows.
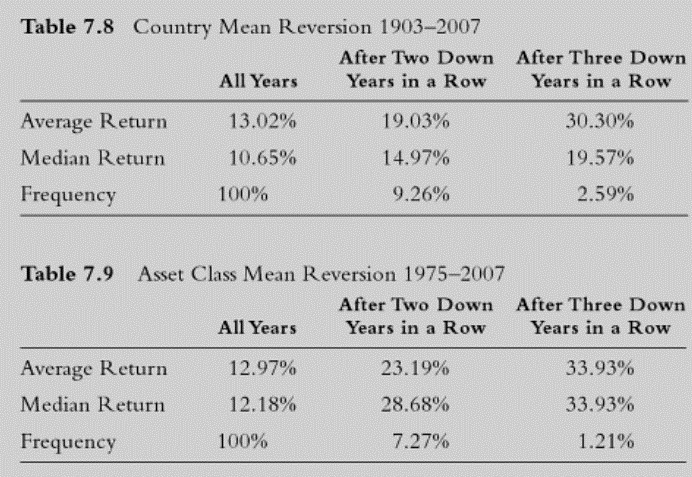
That means a comeback for bonds in the next 12 months wouldn’t surprise.
The other bit of good news for bonds is that five year returns on bonds are highly correlated to their starting yield. Put simply, if you buy a 10-year bond at close to a 5% yield, that yield is likely to be your total return over a five-year period.
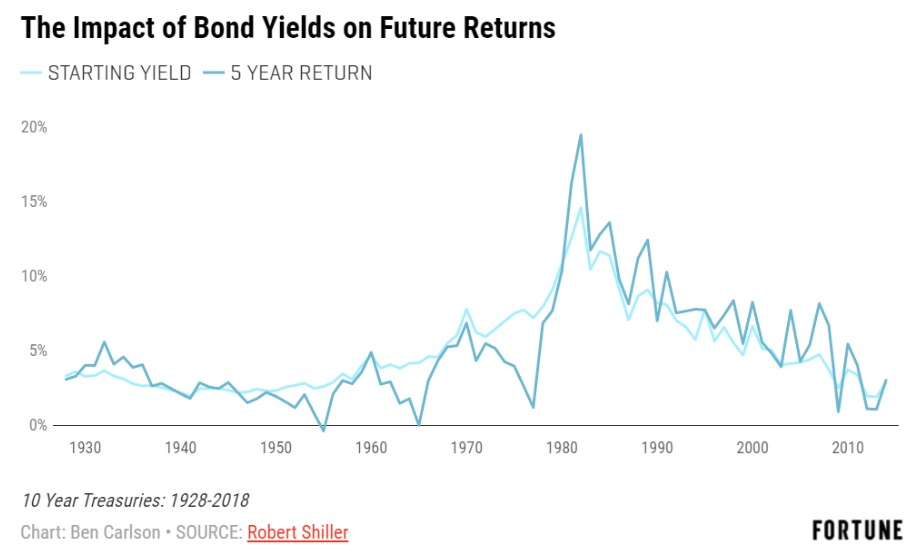
The problem is that this measures nominal bond returns not real returns. The difference between nominal and real returns is inflation. And inflation is a killer for bonds.
For example, during the 1970s, real bond returns in Australia were deeply negative, and they were only marginally positive for global bonds.
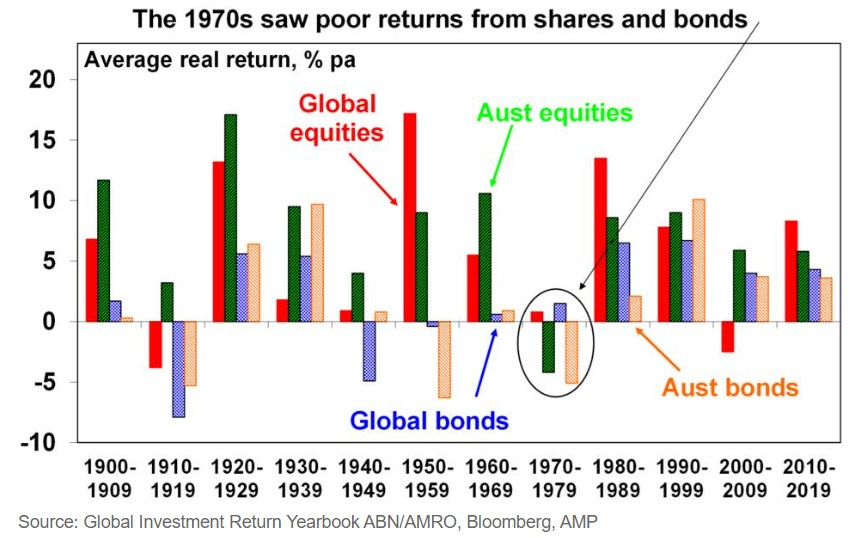
Given current sticky inflation and the potential for a long-term bear market, bonds may have a hard time of it from here.
From the chart above, you can see that equities don’t like high inflation and bond yields either. What the chart doesn’t show though is that certain types of stocks performed well during the 1970s. Namely, value stocks and real assets.
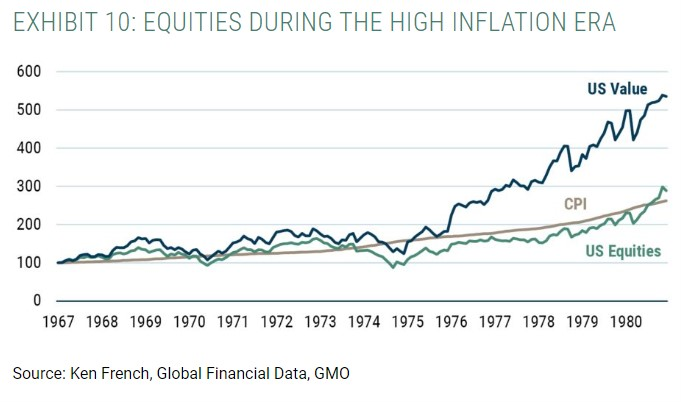
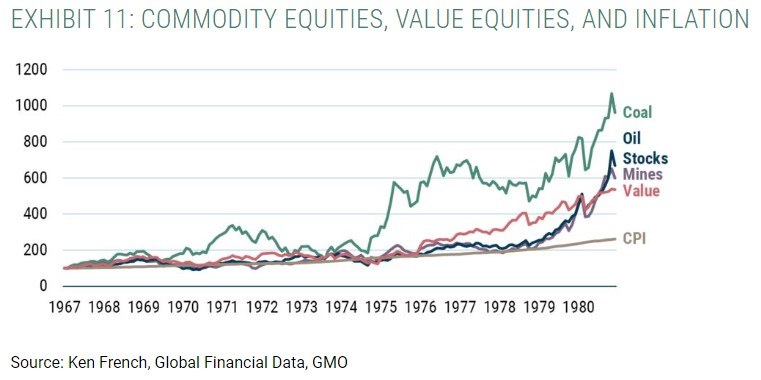
Why did value and commodity equities perform well during the 1970s? As asset manager GMO notes, you were effectively buying cheap real assets, which is a like being offered inflation insurance at a discount.
On the flip side, buying expensive growth stocks is akin to buying inflation insurance at a substantial premium. It’s a warning signal for those investors currently enthused by the ‘Magnificent Seven’ US tech stocks, and other highly priced equities. Inflation and higher yields aren’t friendly for these types of assets.
James Gruber is an assistant editor at Firstlinks and Morningstar.com.au. This article is general information.