"If you had read that article in 1979, you would have suffered - oh, how you would have suffered! - for about three years. I was no good then at forecasting the near-term movements of stock prices, and I'm no good now. I never have the faintest idea what the stock market is going to do in the next six months, or the next year, or the next two."
Warren Buffett, Fortune Magazine, December 2001
***
You're in good company if you don't have a clue what the stock market will do in the next year or two. The queue starts here.
In a recent Firstlinks editorial on asset allocation, we highlighted the risks in a traditional 60% growth/40% defensive portfolio, especially when most of the 40% is earning negligible returns in bonds. Several comments criticised the defensive allocation in a super portfolio required to build wealth for the long term.
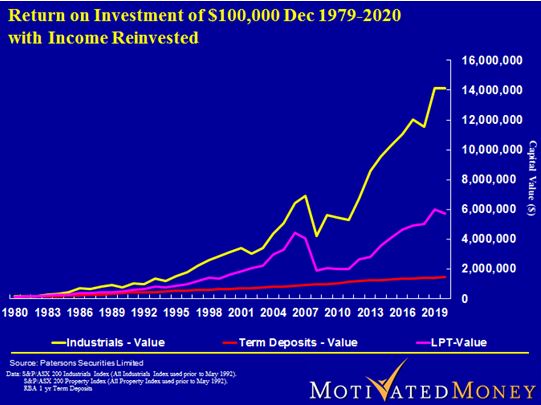
Notably, we were contacted by well-known author and lecturer, Peter Thornhill of Motivated Money, who has consistently argued that investors should hold most of their retirement assets in industrial shares paying steady dividends, avoiding cash and term deposits (other than a three-year reserve to reduce the risk of selling shares in a down market). Peter wrote:
"Your article today is very timely. The super industry serves the public badly. Trying to protect them from short term volatility because of ignorance is an abrogation of their responsibility.
They should be educating the public to understand the monumental price they pay for this stupidity. Adding rubbish like cash, bonds and property is like adding lead to the saddlebags of a racehorse.
(Peter updated his chart showing 40 years of returns on industrial shares, listed property trusts and term deposits).

I left the industry in 2000 for this very reason. I have no qualifications and my role in the funds management industry was purely marketing.
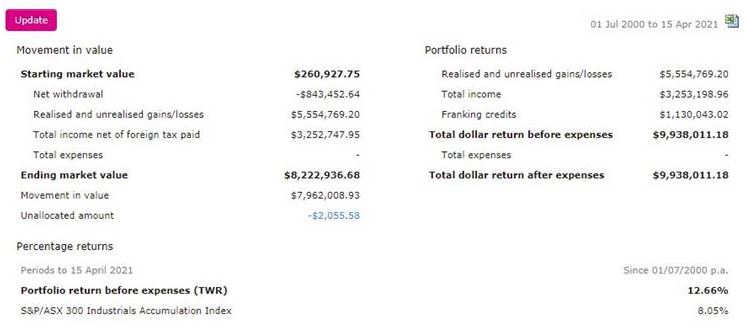
At that time, I started our self-managed super fund. Below is the result over the last 20 years. A combination of minimum cash, no resources, bonds or property, combined with my dumb luck, has served us well.
(Editor's note: Peter gave approval to share his personal spreadsheet. He says his calculation takes into account all contributions made and the performance of each addition from the entry date. TWR is Time Weighted Return. This article shows some of the stocks he owns).

Volatility is not a measure of risk; it is a measure of liquidity. In a super fund, time is on your side and short-term volatility is your friend. Buying CBA at $26 and Wesfarmers at $13, amongst many others, during the GFC was a godsend.
My other major concern is the brouhaha over fee levels. They pale into insignificance compared to the asset mix. The shortfall with the wrong assets over the lifespan of a super holding is monumental."
***
The obvious difficulty with Peter's 'all-in equities' strategy for most retirees is that they cannot tolerate the risk. Watching 90% of your portfolio fall 50% in a market crash when you plan to spend 20 years living on the capital and its income is too much for many to stomach. For peace of mind and a decent night's sleep, retirees accept low returns for low risk and capital protection.
But the cost of this conservatism has never been greater. When term deposits were paying 8%, it was an easier decision to protect capital, but now more investors are heading into riskier assets to generate decent returns.
So far it has paid off.
Unfortunately, nobody runs down the middle of the road waving a red flag the day before a market crash. Those who say they will simply sell before the fall are dreaming. What could trigger this amazing foresight? Anyone who sells after, say, a 5% fall based on the belief that 5% will turn into 50% is just as likely to miss the rebound and sit in cash while the market continues its run.
In the absence of a red flag, all we can do is look to history for a poor guide, recognising the current set of circumstances is unique. But apparently, if we don't learn from history, we are condemned to repeat it, so where better to start than with Warren Buffett.
Buffett's favourite market indicator
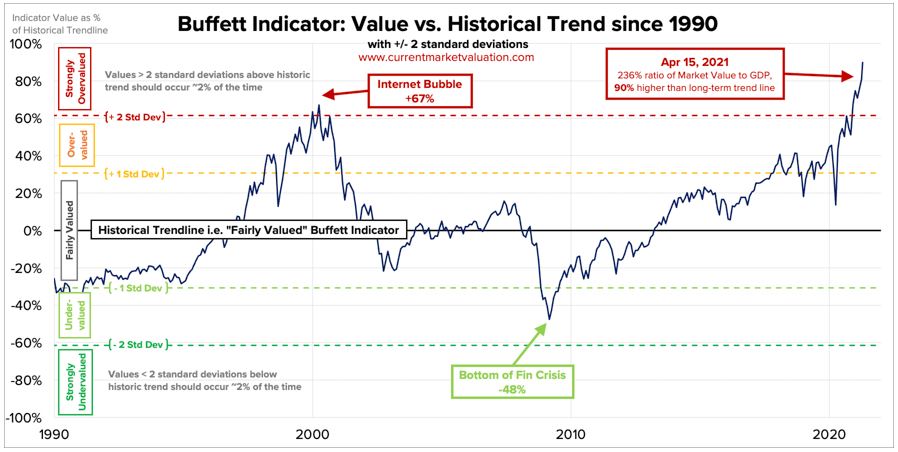
The ratio of the market value of the stock market to GDP has become known as the 'Buffett Indicator' after Buffett told Fortune Magazine that it is: “probably the best single measure of where valuations stand at any given moment.”
It has intuitive appeal, comparing the value of all companies in the Wilshire 5000 Total Market Index (the value of all stocks traded in the United States) with US quarterly GDP. Although it has been trending higher, the theory is that the value of companies should not grow at a faster pace than economic growth for a long time period.
On 15 April 2021, the ratio was an extraordinary 236%, which is not only higher than in the dot-com bubble, it's the highest it has ever been above its long-term trend. It is almost three standard deviations above 'fairly valued'.

Source: Current Market Valuation (CMV)
Should we be worried?
According to Warren Buffett:
"For investors to gain wealth at a rate that exceeds the growth of US business, the percentage relationship line on the chart must keep going up and up. If GNP is going to grow 5% a year and you want market values to go up 10%, then you need to have the line go straight off the top of the chart. That won't happen.
For me, the message of that chart is this: If the percentage relationship falls to the 70% or 80% area, buying stocks is likely to work very well for you. If the ratio approaches 200% - as it did in 1999 and a part of 2000 - you are playing with fire."
Sounds like he never expected to see 236%!
The Buffett Indicator has predicted several historical moments in the US stock market, such as the dotcom bubble (index was 'strongly overvalued'), the bottom of the GFC (index was 'undervalued) and even COVID-19 in February 2020 (index was overvalued).
The big differences in 2021 are the historic low levels of interest rates and central bank willingness to do whatever is necessary to support recovery. Even Buffett concedes that stocks are not always better than bonds:
"But as Keynes would remind us, the superiority of stocks isn't inevitable. They own the advantage only when certain conditions prevail."
And one of those conditions is the entry point, which should not be at an expensive market extreme.
How much buying support remains?
There is an infinite array of charts that can prove anything, but let's take one from John Mauldin's newsletter, Thoughts from the Frontline, where he states:
"Right now, the stock market is in the land-where-there-should-be-sea phase. What we don’t know is when the wave is coming. Maybe there’s time to venture out and see what treasure was hidden beneath the waves ... or maybe not. Prudence would suggest that we go searching for treasure on higher ground."
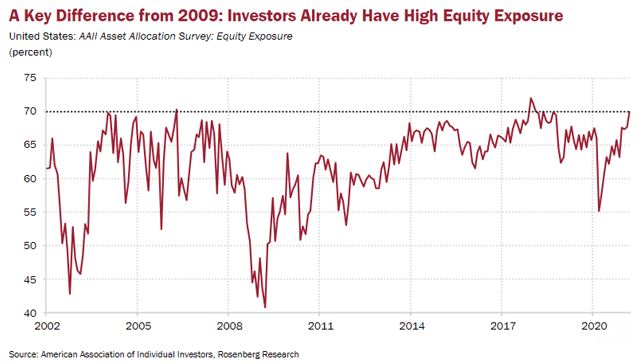
The chart from Rosenberg Research shows the significant amount that US investors have poured into the stock market since the bottom of the pandemic cycle. Mauldin says the investments in equities have already added fuel to the fire and he questions where future buyers will come from.

This fuel has driven the rapid recovery in share prices, far greater than the rise from the lows in recessions such as 1990, 2002 and 2009. The implication is the gains have already been made.
Australian confidence
The latest Westpac-Melbourne Institute Consumer Confidence Index in April 2021 shows a rise from March’s 111.8 to 118.8. Said Westpac Chief Economist Bill Evans:
“This is an extraordinary result. The Index is now at its highest level since August 2010 when Australia’s post-GFC rebound and mining boom were in full swing.”
An Index above 100 indicates the number of consumers who are optimistic is greater than the number of pessimistic consumers, with the long-term average of 101.
Also, NAB’s latest monthly business survey index of over 400 firms registered 25, a record high, and a significant improvement on February's 17. ANZ Senior Economist Catherine Birch said:
“The March NAB business survey confirms our expectations that the impact of the end of JobKeeper on the economic recovery will be short and limited and gives us more confidence in a strengthening business investment outlook.”
Both of which lay the groundwork for economic growth and business profits. However, the one-year forward price/earnings ratio of the Australian market is 19 times, or about 30% over the long-term trend, leaving little margin of safety.
The final words
While share prices are high based on historical metrics, lenders and central banks are delivering plenty of liquidity and stimulus. The pandemic has loosened the purse strings like never before in history, and banks are not inclined to seize assets as they have in previous cycles.
Let's finish with another Warren Buffett statement from his most recent annual shareholder letter, with a simple focus on long-term investing that support's Peter Thornhill's general strategy:
"All that’s required is the passage of time, an inner calm, ample diversification and a minimisation of transactions and fees."
Graham Hand is Managing Editor of Firstlinks. This article is general information and does not consider the circumstances of any investor.