The performance of the Australian share market in recent years has surprised many not just for how weak it has been relative to the US and other developed markets, but also relative to previous major bear markets in Australia.
Underperformance relative to the US market
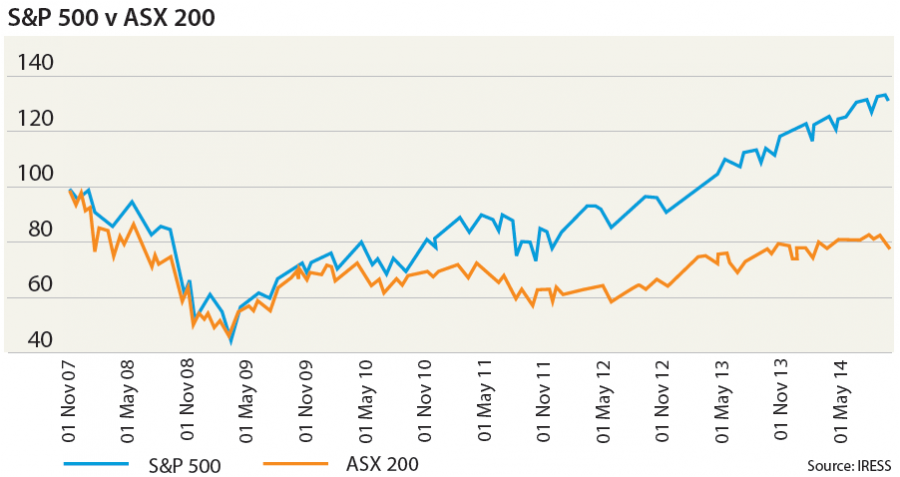
The graph below shows how closely correlated our market (orange) was with the S&P500 (blue) on the way down but how relatively tame our market’s recovery has been.

So what might the explanation be? One possibility is simply the alternatives available to investors in each country. In the US interest rates available on cash and bank deposits have effectively been zero for 5 years. In Australia, on the other hand, deposit rates have been generous and even at their current lows of around 3.5% at least provide a positive return after inflation. So for those investors who have decided at least for the time being that the ups and downs of the share market are not for them, in Australia there has been a viable income-producing alternative.
It is also worth emphasising that although the correlation between our market and the US equity market can be very strong on a day-to-day basis, over longer periods the markets can behave very differently reflecting the differences in the two economies. So when the tech boom was in full swing around 2000 and Australia’s economy was derided for being ‘old economy’ the US market was very much stronger, but the pecking order reversed with the tech wreck and the resources boom.
Underperformance relative to previous cycles
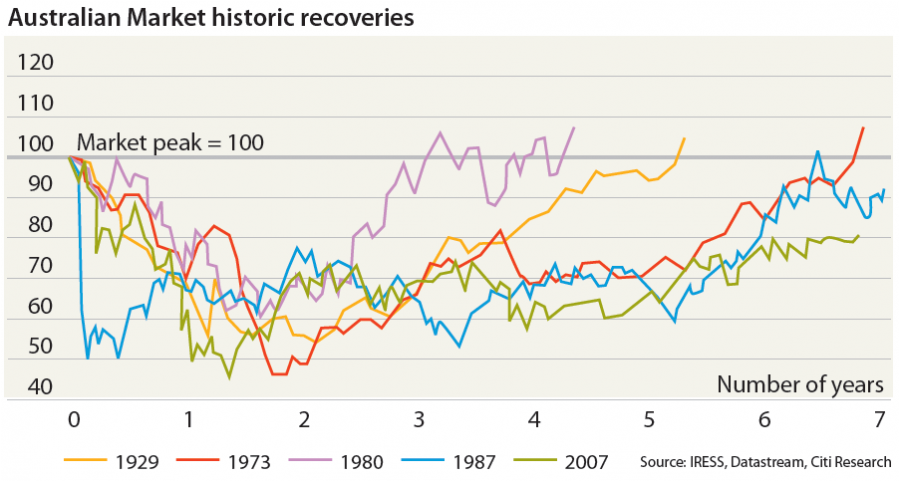
The performance of the Australian market relative to its own history also looks pretty grim. The chart below shows that seven years on from the GFC, we have still not nearly regained the previous market peak and the recovery looks markedly slower than bear markets that took place in the context of the Depression and the severe recessions of the 1970s and 1990s. While there are complaints about current low levels of growth and increased unemployment, relative to those earlier episodes recent years have been fairly benign.

A couple of major differences in the current cycle that may be relevant are the much higher levels of individual debt and the ageing population.
To begin with, to the extent that individual debt was used to fund investments, it would have increased the effective losses. Secondly, the combination of a sudden reduction in net worth and impending retirement has no doubt persuaded many that they should save more for their retirement rather than rely on the growth of their investments. This is consistent with savings rates that are the highest in a generation.
Valuations now look attractive
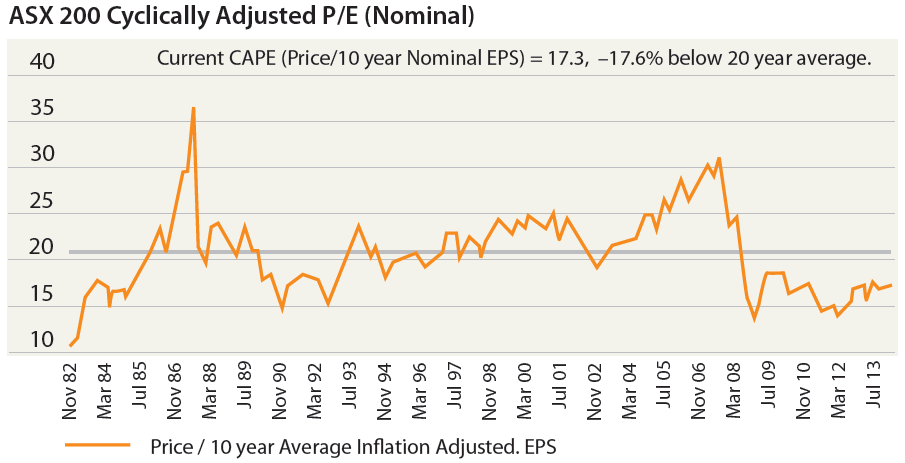
One factor which would at least partially explain both aspects of the Australian market’s disappointing performance is that Australian shares may simply be cheap. While the most commonly quoted metric is the price/earnings ratio, it does not take into account the fluctuations in profit margins at different points in the economic cycle. Accordingly, the ‘cyclically-adjusted price/earnings ratio’ (CAPE) developed by Robert Shiller (winner of this year’s Nobel Prize for economics) provides a more reliable guide to valuation by using 10 years of earnings rather than just one. The chart below uses that methodology and suggests that there is plenty of room for Australian equities to rise before they reach long term average levels.

But while valuations are critical when it comes to long term returns, in the short run (say less than three years) other factors including investor attitudes to different asset classes are often more important, so there is no guarantee that our market’s underperformance will end overnight.
Frank Macindoe is an Executive Director at JBWere and a responsible manager of Third Link Growth Fund. The views expressed are his own. This article is general information for educational purposes and not personal financial advice.
This article was first published in Third Link News. The Third Link Growth Fund provides exposure to Australian listed shares by investing in other managed funds run by third party investment managers, as selected by Chris Cuffe. Since inception in June 2008, it has outperformed its index by 3.8% pa. Each of the investment managers rebates all fees, and Third Link donates the management fees to the charitable sector. A description of the underlying fund managers is available on the Third Link website.