2023 was a good year for the Australian share market, but where does it sit in historical terms?
The past five years were actually rather boring and ho-hum for the share market – despite a host of extreme events like the Covid lockdowns, steep recessions, inflation spikes, aggressive rate hikes, wars, rising military tensions, bank collapses, etc.
Here are our Annual Return Pyramids for the Australian share market.
This first chart shows total returns (ie capital gains plus dividends) from the broad Australian share market per calendar year since 1900. The returns are organised in 5% bands – from the worst years at the left through to the best years to the right.
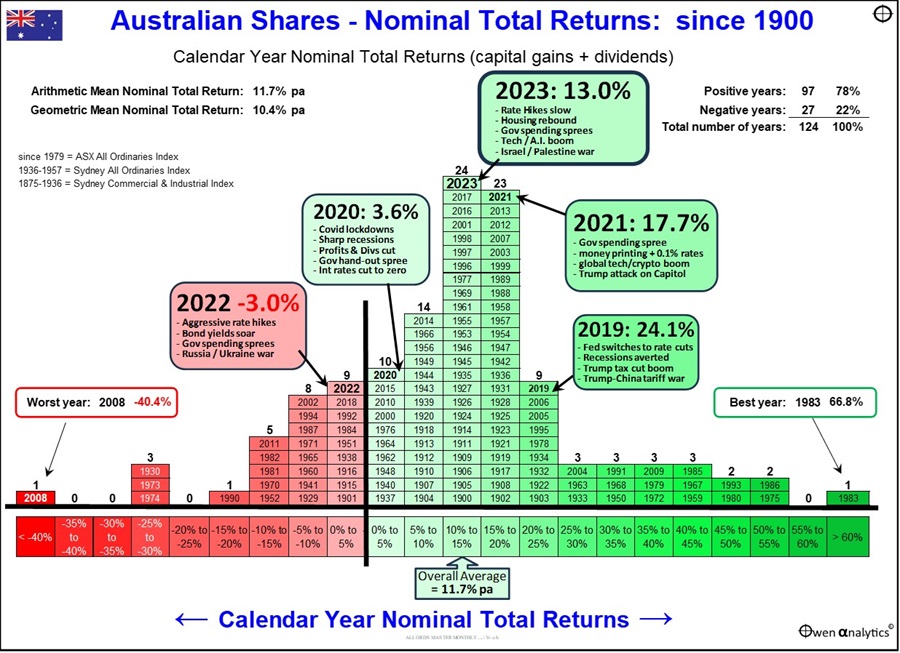
Although the market has returned an average of more than 11% per year overall, the returns each year have ranged from very deep negative years to very large positive years.
The worst year was 2008, with a return of minus 40%, in the depths of the 2008-9 ‘Global Financial Crisis’ triggered by the US sub-prime collapse. The 2008 negative year came after five consecutive years of strong gains in the 2003-7 China/credit boom.
The best single year was 1983, with a return of +67% in the tremendous rebound out of the 1981-3 recession, which had caused negative years in 1981 and 1982.
Very high positive returns and very low negative returns are relatively rare.
Most of the years are bunched in the ‘boring’ middle third of the chart. 39% of all years were between 10% to 20% range.
One thing that stands out is that the great majority of years have been positive for the overall share market.
- 78% of years were positive
- 70% of years were above 5%
- 59% of years were above 10%
- 40% of years were above 15%
- 21% of years were above 20%
- Only 22% of years were negative, 15% were worse than -5%, and only 8% of years were worse than -10%.
Past five years
The chart highlights returns for the past five calendar years.
- Four out of the past five years were positive, including 2020 with the Covid lockdown recessions
- 2022 was the only negative year in the past five years, and it was very mild at just -3%.
- Three out of the past five years were well above average
‘Volatility!’ – what Volatility?
The other notable stand-out from this chart is the fact that these past five years fall into the ‘boring’, ho-hum middle third of the chart, but look what happened during those five years:
- Governments locked entire populations in their homes for months on end for the first time in history
- the sharpest and deepest economic recessions since the 1930s Great Depression
- soaring inflation everywhere
- savage interest rate hikes
- extraordinary new monetary policies and policy errors
- the first major war in Europe since WW2
- new wars and flare-ups in the Middle East
- a new ‘cold’ war between China and the US
- trade wars, tech wars
- commodities booms and busts
- tech booms and busts
- bank collapses in the US and Europe
- our main export buyer, China, ground to a halt with the collapse of its main driver of growth - construction
Despite all of this so-called ‘volatility’ and ‘uncertainty’, the local share market sailed through it, staying in the middle section of the chart, avoiding extreme highs and lows on the left and right of the chart.
Real returns after inflation
The above section relates to ‘total returns’ that include price changes plus dividends, but they do not take into account the wealth-destroying effects of inflation. We adjust returns for inflation in the next chart.
Like the previous chart, the returns are organised in bands – from worst years at the left through to the best years to the right.
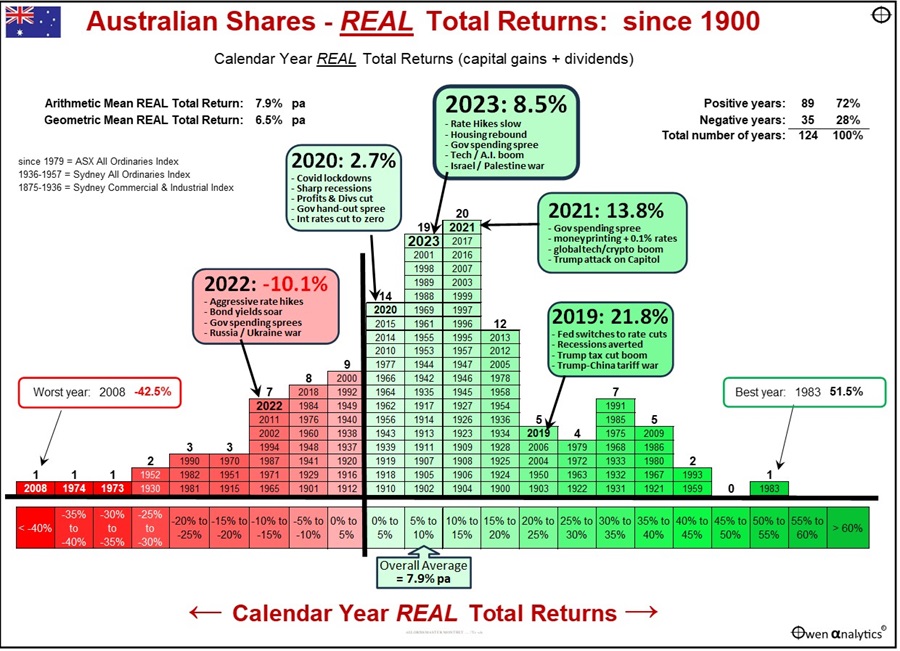
A quick comparison of the two charts shows that the real returns for most years are shifted a little to the left on the scale of return bands (ie lower real returns) compared to the previous ‘nominal’ return chart.
However, there were some years with negative CPI inflation, so ‘real’ returns were higher than ‘nominal’ returns. The years of negative inflation were 1900, 1903, 1904, 1921, 1922, 1924, 1927, 1930, 1931, 1932, 1933, 1944, 1962, and 1997.
Real total returns from the market averaged nearly 8% per year after inflation, compared to more than 11% per year before inflation, because inflation averaged 3.7% per year over the period. Like the previous chart, real returns each year have ranged from very deep negative years to very large positive years.
The worst year for real returns was still 2008, in the GFC.
The best single year after inflation was also still 1983, despite inflation was running at 10.1% for that year.
Good CPI+ returns
Even after the effects of inflation, the majority (72%) of all years were positive for shares, and 60% of years were better than CPI+5%, ie more than 5% above inflation.
This is a great outcome for investors, and a good reminder that broad share markets are one of the best hedges against inflation.
Ashley Owen, CFA is Founder and Principal of OwenAnalytics. Ashley is a well-known Australian market commentator with over 40 years’ experience. This article is for general information purposes only and does not consider the circumstances of any individual. You can subscribe to OwenAnalytics Newsletter here. Original article is here: ‘Australian Share Market Annual Returns Pyramid