Register For Our Mailing List

Register to receive our free weekly newsletter including editorials.

Home / 572

CBA could drag down the ASX 200 in coming years

CBA has been in the headlines of late for a few reasons – for re-taking the lead from BHP to be the largest ASX-listed company by market value, for being the most over-priced bank in the world, and also for having the most mysterious share price surge this year.

My main interest in CBA (aside from being a former shareholder), is that it will probably be a significant drag on the overall Australian share market in coming years. This is critical when deciding asset allocation in diversified long-term portfolios.

Even if investors, advisors, and portfolio managers have no interest in stock picking or stock valuation, they need to take a view on CBA, given its heavy weighting it the local share market, and its impact on overall portfolio returns.

Unfortunately, all good things come to an end

This is not a bold new call from me – the turning point was in 2015, nearly a decade ago. (I am no longer a CBA shareholder). CBA and the rest of the ‘big-4’ retail banks peaked in 2015, and their underlying fundamentals have deteriorated significantly since then.

CBA’s share price may have soared, but the underlying business has stalled.

My worry is that people who benefited from CBA’s past growth are now expecting it to continue the same upward trajectory and generate the same great returns in the future. Many are hanging on to CBA in the hope that its dividends will continue to form the core of their retirement incomes.

My fear is they will be disappointed. Rather than lead the overall market, as it did up until 2015, CBA is likely to lag the market in future.

Quick background – CBA: the ‘Steven Bradbury’ of the big-4 retail banks

CBA was one of the great stars of the 1990s government privatisation program, which was a key part of the productivity-boosting Hawke/Keating reforms of the 1980s and early 1990s. (Just don’t mention that to Smiling Jim Charmer as he desperately tries to drag Australia back to the dark ages of the pre-reform era!)

CBA was a sleepy government department when it was sold off and floated in 1991. It was the least favoured and second smallest of the ‘big-4’ banks, but it is now by far the largest of the banks in terms of market value, profits and dividends.

How did this happen? Essentially, because the other three big banks did their best to blow themselves up!

CBA is thus the ‘Steven Bradbury’ of Australia’s big banks. It has done nothing spectacular - it just kept a steady, somewhat boring course (aside from the Hayne revelations of institutionalised greed that drove a dizzying array of unsavoury and unethical activities), but the others did a lot worse and tripped over themselves.

After bank deregulation in the mid-1980s, the two most aggressive business lenders - Westpac and ANZ - went mad in a wild lending spree and suffered huge, near-existential losses in the early 1990s ‘recession we had to have’ and have never fully recovered. NAB, which sensibly (or luckily) was asleep during the 1980s lending frenzy, leapfrogged into the lead.

But then NAB also went mad in the 1990s and 2000s and blew its lead thanks to a string of costly own goals, mainly with its disastrous overseas adventures. As NAB fell by the wayside, CBA overtook it to become the largest and most profitable of Australia’s big-4 retail banks.

For a run-down on the recent history of the big banks, see Which Bank? is winning the Battle of the Banks?

Share price has run well head of dividends or profits

In terms of share price gains, CBA has been a star in recent years. Its share price had been stuck at around $80 pre-Covid, then fell below $60 in the 2020 Covid lockdown recession sell-off, but more than doubled to $130 by mid-2024.

Why? It’s a mystery to me and most analysts. One theory is that much of the buying has come from global institutions selling out of China but having to retain exposure to Asia-Pacific. Australia is a ‘safe haven’ in Asia, but they wanted to avoid the big miners because of their exposure to China, so they went for the banks instead. A related theory is that passive index funds have been forced to buy CBA due to its sheer weight in the index, forcing it up even further.

Either way, CBA’s share price has run up well ahead of fundamentals. This is the focus of today’s story.

Chart A – share prices -v- dividends

This chart shows CBA’s share rice (yellow) since the 1991 float, thoroughly beating the market benchmark ‘All Ordinaries index’ (grey line).
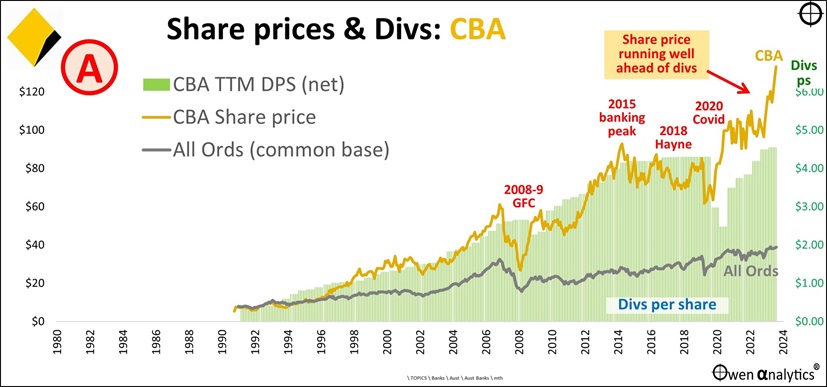
The problem is that the share price has run well ahead of cash dividends (green bars). Dividends were cut in Covid and have only just rebounded to 2015 levels, but the share price has doubled. (‘TTM’ means ‘trailing twelve months’).

This means buyers are now paying two times per dollar of dividends than they were a decade ago.

Chart B - Dividends, franking, and real dividends

In the next chart, the green bars represent cash dividends per share each year (same as Chart A), but here we also show franking credits attached to the dividends (orange bars). Adding the two together, we arrive at the ‘grossed-up’ dividends per share (black line) for tax-free investors (eg Australian pension funds, charities, but notably not foreign shareholders).

The grey line shows the ‘grossed-up’ dividends in real terms (after CPI inflation).
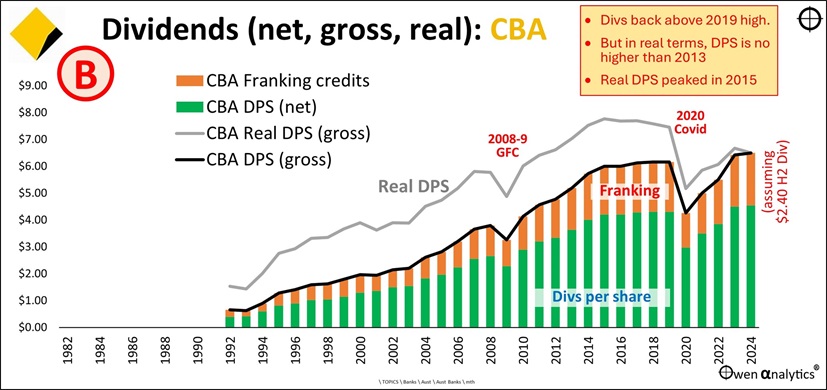
This grey line highlights the problem. Real dividends per share peaked in 2015 and are still well below those levels a decade later.

Dividends per share in nominal (pre-inflation) terms are at least back above their 2019 pre-Covid high. But in real terms after inflation, dividends per shares are no higher now than they were in 2013 - that's more than a decade of no real growth in dividends.

Chart C - Pricing – expensive relative to dividends (dividend yields)

So, the pricing of CBA shares relative to dividends is now unusually expensive.

Chart C below shows CBA’s net (cash) dividend yield (yellow) compared to the cash dividend yield for the overall ASX market (grey line).

CBA’s dividend yield has always been around 1.5% above the dividend yield of the overall market. The reason for this traditional dividend yield premium is the fact that CBA (and the other big retail banks) are low-growth, mature giants with little room to grow, and they are highly cyclical, with extremely high leverage. (CBA is currently geared 17:1, or in home lending terms, has a ‘Loan-to-Value’ ratio of 94%).
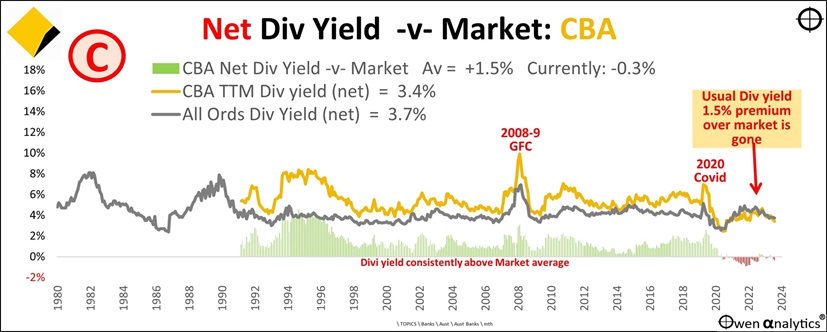
The green bars running along the bottom show the dividend yield premium to the overall ASX market (ie CBA div yield less overall market div yield). This is normal for all large banks in all markets around the world.

However, this traditional dividend yield premium to the overall market (positive green bars) is gone. In fact, for most of the past three years CBA has traded at a lower dividend yield than the market (ie the positive green bars have been running at negative red bars).

Chart D - Pricing – expensive on grossed-up dividend yields

Chart D is the same as C except it is based on grossed-up dividend yields (including franking credits).
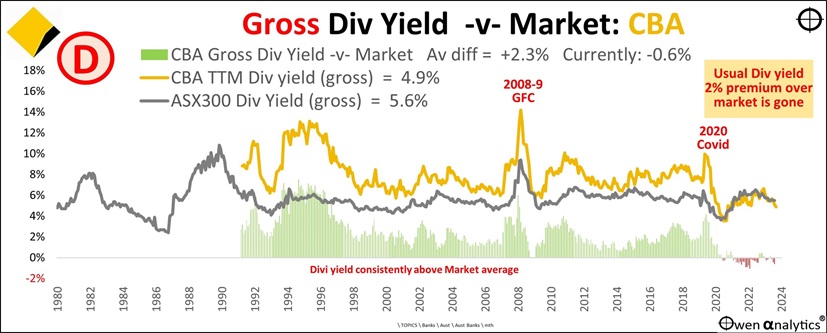
The traditional grossed-up yield premium of +2.4% pa above the overall market is also now negative (negative red bars instead of positive green bars) in recent years.

Chart E - Pricing – expensive relative to profits (price/earnings ratios)

Here we show CBA’s share price relative to profits (‘price/earnings ratio’) – ie how much are buyers paying per dollar of profits.

CBA’s p/e ratio (yellow line) has traditionally been lower than the overall market p/e (grey line) – again because CBA is a highly cyclical, highly geared, mature, low-growth giant. This is normal for all large banks in all markets around the world.

The negative red bars at the bottom (CBA p/e less overall market p/e) indicate CBA’s traditionally lower p/e for most of the past three decades as a listed company.
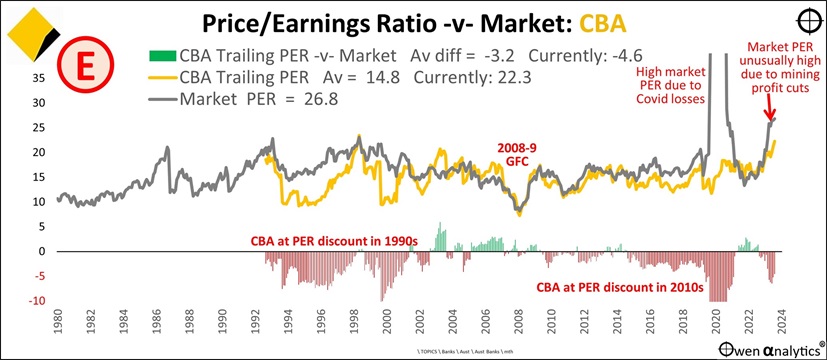
To the right we see CBA’s current price/earnings ratio has now shot up to a very high 22 times earnings – ie buyers are paying $22 per $1 of profit. Ordinarily it would make no logical sense to pay any more than around $15 per $1 of profit for a low-growth, mature big bank like CBA.

On the chart we see that this high current p/e of 22 for CBA is actually still lower than the overall market p/e ratio of 26 times earnings, but that is unusually high at the moment because of last year’s disappearance of much of the windfall post-covid iron ore profits from BHP, RIO, and FMG. The market p/e is high because the market is expecting these windfall iron ore profits will suddenly re-appear. (That is by no means certain).

You can’t look at CBA’s very high p/e of 22 and say: “That is ok because it is still lower than the market p/e of 26!”

The fact that the market p/e is temporarily high because of the temporary ups and downs of windfall iron ore profits has nothing at all to do with CBA.

We should ignore the completely unrelated iron ore/China story and ask instead: why are buyers suddenly paying $22 per $1 of CBAs profit?

Over the past year, CBA has suddenly been fundamentally re-rated by the market – either it has suddenly become a ‘growth stock’, or it has suddenly become less risky.

Neither is the case. It is still just a bloated building society confined to property lending in Australia, it is still highly geared, and highly exposed to the highly-geared Australian property market.

Chart F - Declining growth + declining returns on equity

Here’s the twin problem. CBA is the opposite of a growth stock:
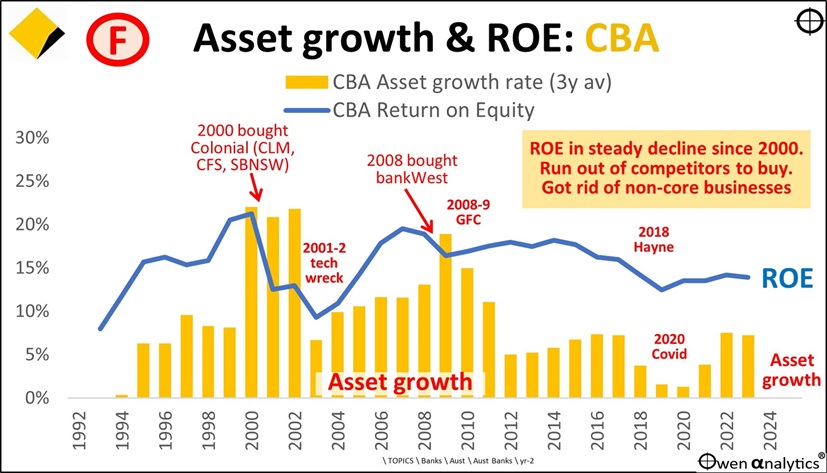
Returns on equity (blue line) have been declining for the past 25 years. ROE peaked at more than 20% in 2000 but is down to a rather ordinary 13-14% pa in recent years.

Asset growth rates (yellow bars) have also been declining for the past 25 years. CBA has run out of things to buy, and has been forced to shed its non-core, conflicted, cross-selling businesses. Asset growth rates in recent years have barely kept pace with inflation.

Chart G - Outlook? – better than recent years, but the early glory days are over

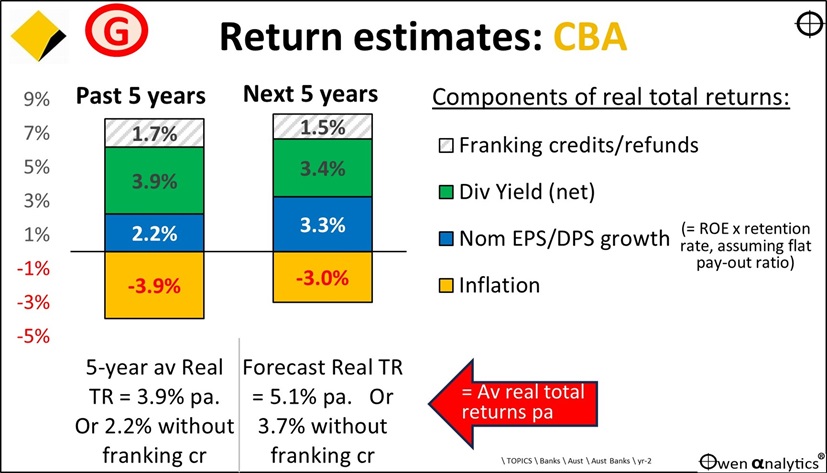
This chart breaks down returns from CBA (based on underlying fundamentals) into its main components, for the past five years (left bars) and the likely future five years (right bars):
(For the purpose of this outlook, I ignore short-term impacts like recessions – where profits, dividends, and share prices would fall temporarily but then rebound, with little or no long-term damage).

This approach estimates real total returns at around 5% pa over the next five years. The components are:

  • Current trailing cash dividend yield of 3.4%
  • Plus franking credits of 1.5%
  • Plus likely nominal earnings growth of around 3.3% pa
  • Less likely CPI inflation of around 3.0% pa.
  • = real total returns of around 5% pa ignoring any share price reversion to fair pricing

Or, excluding franking credits to zero-tax investors, a real total return of around 3.7% pa. That’s very ordinary.

NB: This assumes that the current level of over-pricing can be maintained. If the share price falls back to more reasonable levels relative to profits and dividends, this would reduce total returns. For example, based on the very ordinary fundamentals, a ‘fair price’ would be well below $100.

The key variable here for long term returns is likely future earnings growth. I assume that future sustainable ROE is going to be around 13% at best (the average in recent years). If CBA retains just 25% of its earnings (ie continues to pay out 75% in dividends), then that caps EPS growth to just 3.3% pa. That’s barely above inflation.

And that doesn’t allow for likely increases in regulatory and compliance costs, nor any increase in competition (future competition from the US big tech is the main threat here, not the other local banks).

The ‘good news’ from this chart – particularly for retirees who are relying on dividends rather than share prices - is that dividends per share may be able to at least keep pace with inflation – which is a lot better than the past decade when dividends lagged inflation (chart B).

What to do?

Potential buyers would need to ask – why pay $22 (or anything above say around $15) per dollar of profits for a low-growth, highly geared, highly cyclical, highly political, bloated building society, with rising compliance and regulatory costs, increasing competition on all fronts, and limited growth potential?

For existing shareholders, much would depend on their cost base and potential capital gains tax on sale.

Extreme concentration of risk factors

Australia has an extraordinarily broad and diverse economy and business landscape, but decisions about allocations to Australian shares in diversified portfolios come down to two very narrow factors that dominate the local share market - the current over-pricing and likely poor performance of the big banks (led by CBA), and iron ore profits.

Those two very narrow and specific questions dominate the fate of the overall local share market, and diversified fund returns.


Ashley Owen, CFA is Founder and Principal of OwenAnalytics. Ashley is a well-known Australian market commentator with over 40 years’ experience. This article is for general information purposes only and does not consider the circumstances of any individual. You can subscribe to OwenAnalytics Newsletter here. Original article is here: CBA in 7 charts – the ‘Steven Bradbury’ of Australian banking – now suddenly a ‘growth stock’?.


12 Comments
Backup Now
August 12, 2024

CBA is clearly the technology leader of the four retail banks as they made the difficult and costly decision many years ago to replace their Core Banking Systems (CBS) with much newer and more flexible applications. And this helps them to continue to generate attractive profits for their shareholders, especially ones who have held shares for over 30 years.

Retail banking these days is all about technology - when was the last time you visited a branch or even an ATM? Your computer talks to their "computer" and the CBA's applications are streets ahead of all others. This obvious advantage will not be discussed in any technical analysis. Before you invest in any bank you need to understand their CBS technology roadmap as the implementation and support costs are massive and always understated.

mike
August 11, 2024

Thank you AO. My take away is

" One theory is that much of the buying has come from global institutions selling out of China but having to retain exposure to Asia-Pacific. Australia is a ‘safe haven’ in Asia, but they wanted to avoid the big miners because of their exposure to China, so they went for the banks instead. A related theory is that passive index funds have been forced to buy CBA due to its sheer weight in the index, forcing it up even further. ".

Before your article, I could not work out why CBA price keeps on going up.

Peter
August 11, 2024

Who knows where the CBA share price will go. Look at Macquarie Bank!!!!

Kevin
August 12, 2024

I have,thought I'd check as I thought I did well with them.The trusty,and heavy lever arch file of facts. I need to split it into 3 banks each and a new file.So ANZ,CBA and NAB in one,and WBC MQG and SUN ( Suncorp) in the other.

First 10 years of Mac was a wash out,stopped the DRP in Dec 2008 @ $29.06 a share.I needed to reduce debt.for the GFC that I was beginning to think this is bad,take action. I might not be bullet proof .Unless I have mislaid CHESS statements the story picks up again in March 2015 , ~10 years after the first purchase

2015 $73.50 a share ( SPP ? I think)

Nov 2015 $79.40 a share ( Capital raising I think )

Sept 2019. $120 each ( Capital raising 99% sure)

Dec 2021. $191 each. ( Capital raising 100 % sure)

Up it went then

May 2022 $188 each , on market,it had come back down.

June 23 $171, on market they kept going down,I think.Next target $150. I think it got down to $155,.I started to put an order in @ ~ $164,then thought I don't need to do anything,white line fever cured,get off the pitch ,never to go back on,unless there are more SPPs or capital raisings.

First 10 years,oh dear,couldn't keep the DRP going,needed to reduce debt.

Second 10 years that will end Mach 2025,things are looking good

Third 10 years?.Who knows,nobody can predict the future.I am bullet proof now though.

Sometime from 2015 on they spun out Sydney airport ,1 SYD for 4 MQG,or 1 SYD for 5 MQG,I forget.

Should Ashley be right about CBA then say over the next 10 years CBA rises to $150 a share. Dividend goes up to $5 ( net) a share . A good income from them now which we can live on without anything else..I think it will be a good income in 10 years,and still have everything else as a bit of icing on the cake.

Mark
August 11, 2024

As a soon to be retiree I can live off dividend income I can't live off the next best thing. Buy, hold, drink the morning coffee is my motto. I know the financial industry can't clip my ticket either, shame ;-)

Dudley
August 12, 2024

Dividend, / capital, 6 one / half dozen other [except for 0% taxed who recover franking credits annually] :

With automatic dividend reinvestment, could say that all withdrawals [selling shares] are pure capital.

Graph G estimated future real return 5%; estimated future real capital growth 0%, withdrawals to 95 from 65, for each $1 invested at 65 (- = in share), $0 left; percentage of capital withdrawable:

=PMT((1 + 5%) * (1 + 0%) - 1, (95 - 65), -1, 0)
= 6.51% / y

Steve
August 09, 2024

Interesting psychology experiment here. CBA stockholders say they wouldn't buy more shares at this price but at the same time wouldn't contemplate selling. This is logically inconsistent. If you had say $1000 and could invest anywhere would CBA be where you put the money (At the current price)? If the answer is NO then you sell the CBA and invest the proceeds in the preferred choice. Classic case of harder to decide to sell than buy, even when you've concluded the price is exuberant.

Kevin
August 10, 2024

Don't cherry pick to find what you want to see Steve,it is nonsense what you have come up with.

Chess statements arrive for my July bank DRPs.My book of facts falls open at CBA ,the book of facts is very heavy,DRPs that go back decades.

Fortunately C comes before N (NAB).So CBA capital raising was 10 Sept 2015 @ $71.50,I thought it was around 2017 or 2018.

Do you really think I should sell those shares because I'm not buying any more today.Pay the CGT,give up a good dividend,then what?.Where is there any logic in that?

On a shorter time frame, say 18 months ago ,buy more CBA ( ~ $93)I sell them pay CGT etc,because I'm not buying any at $130.

The idea is very simple,buy good companies at low prices,collect dividends,or reinvest them.

My next target price for CBA would be ~ $100.I'm not buying at that price because I don't have a 20 or 30 year period ahead of me if it hits that ~ $100 price.If I was younger I would,however if I was younger I wouldn't have 33 years of experience collecting more shares at low prices and using the DRP constantly for 33 years.

Buying and selling ticker symbols is expensive,compounding good companies provides astonishing results .

The great wisdom of "simple,but not easy". I wouldn't be taking advice from an article on firstlinks or anywhere else for a short period of time,or a kneejerk reaction.

From 2015 until now, CBA,a great capital raising. ANZ ~$19,a great capital raising. NAB ~ $15,wonderful. As Ashley mentioned "in retirement". A high dividend income for the last 9 years,opportunities galore to pick up more shares cheaply,that is logical.

The only failure is WBC,I think their raising was at $24. Then again I'd like to sit in on a WBC directors meeting. " We haven't tried to blow ourselves up for a few months chaps,shall we have another go at it"?

John Slate
August 09, 2024

CBA as a business continues to perform well. Every fourth or fifth dollar in Australian economy flows through it in one form or another. It is at least 5 years ahead of its competitors in back office automation and front office technologies.
It will remain a satisfactory investment for years to come.
Writer's analysis is basically focusing on stock market price action that only tells half the story.

SGN
August 09, 2024

Fully agree with Errol and Keith comments.

The writer of this Article is an X shareholder and his well worded article can not muster with long time CBA shareholders who bought them at float and continued with reinvestment plan.CGT can be one big cost to sell the holdings.

Errol
August 08, 2024

Yep, on any technical analysis CBA doesn’t stack up for a new investor. However, I have heard these comments many times before over the years and yet the CBA share price continues to climb up and up providing shareholders with solid returns. While I wouldn’t be a buyer at today’s prices and would certainly have taken some profits along the way, I wouldn’t be betting against CBA either. As always, a balanced, diversified portfolio in keeping with your risk profile and investment objectives is the strategy

Keith
August 09, 2024

Have to agree with your sentiments Errol. Have seen these technical analyses many times over the years by the algorithmic, multi-screen "techsperts".Through all the reasons why CBA will not meet investor expectations......THEY CONTINUE TO ACHIEVE BETTER THAN EXPECTED RETURNS. As a long term [now retired] CBA shareholder, would I increase my holding on today's prices....NO! But will I have reservations about maintaining my holding within my SMSF....again NO! 


Leave a Comment:

RELATED ARTICLES

ASX large cap outlook for 2025

Rosy markets ignore darker dividend outlook for ASX

The case against owning Aussie banks

banner

Most viewed in recent weeks

Australian stocks will crush housing over the next decade, one year on

Last year, I wrote an article suggesting returns from ASX stocks would trample those from housing over the next decade. One year later, this is an update on how that forecast is going and what's changed since.

What to expect from the Australian property market in 2025

The housing market was subdued in 2024, and pessimism abounds as we start the new year. 2025 is likely to be a tale of two halves, with interest rate cuts fuelling a resurgence in buyer demand in the second half of the year.

Howard Marks warns of market froth

The renowned investor has penned his first investor letter for 2025 and it’s a ripper. He runs through what bubbles are, which ones he’s experienced, and whether today’s markets qualify as the third major bubble of this century.

The perfect portfolio for the next decade

This examines the performance of key asset classes and sub-sectors in 2024 and over longer timeframes, and the lessons that can be drawn for constructing an investment portfolio for the next decade.

9 lessons from 2024

Key lessons include expensive stocks can always get more expensive, Bitcoin is our tulip mania, follow the smart money, the young are coming with pitchforks on housing, and the importance of staying invested.

The 20 most popular articles of 2024

Check out the most-read Firstlinks articles from 2024. From '16 ASX stocks to buy and hold forever', to 'The best strategy to build income for life', and 'Where baby boomer wealth will end up', there's something for all.

Latest Updates

Investment strategies

The perfect portfolio for the next decade

This examines the performance of key asset classes and sub-sectors in 2024 and over longer timeframes, and the lessons that can be drawn for constructing an investment portfolio for the next decade.

Shares

The case for and against US stock market exceptionalism

The outlook for equities in 2025 has been dominated by one question: will the US market's supremacy continue? Whichever side of the debate you sit on, you should challenge yourself by considering the alternative.

Taxation

Negative gearing: is it a tax concession?

Negative gearing allows investors to deduct rental property expenses, including interest, from taxable income, but its tax concession status is debatable. The real issue lies in the favorable tax treatment of capital gains. 

Investing

How can you not be bullish the US?

Trump's election has turbocharged US equities, but can that outperformance continue? Expensive valuations, rising bond yields, and a potential narrowing of EPS growth versus the rest of the world, are risks.

Planning

Navigating broken relationships and untangling assets

Untangling assets after a broken relationship can be daunting. But approaching the situation fully informed, in good health and with open communication can make the process more manageable and less costly.

Beware the bond vigilantes in Australia

Unlike their peers in the US and UK, policy makers in Australia haven't faced a bond market rebellion in recent times. This could change if current levels of issuance at the state and territory level continue.

Retirement

What you need to know about retirement village contracts

Retirement village contracts often require significant upfront payments, with residents losing control over their money. While they may offer a '100% share in capital gain', it's important to look at the numbers before committing.

Sponsors

Alliances

© 2025 Morningstar, Inc. All rights reserved.

Disclaimer
The data, research and opinions provided here are for information purposes; are not an offer to buy or sell a security; and are not warranted to be correct, complete or accurate. Morningstar, its affiliates, and third-party content providers are not responsible for any investment decisions, damages or losses resulting from, or related to, the data and analyses or their use. To the extent any content is general advice, it has been prepared for clients of Morningstar Australasia Pty Ltd (ABN: 95 090 665 544, AFSL: 240892), without reference to your financial objectives, situation or needs. For more information refer to our Financial Services Guide. You should consider the advice in light of these matters and if applicable, the relevant Product Disclosure Statement before making any decision to invest. Past performance does not necessarily indicate a financial product’s future performance. To obtain advice tailored to your situation, contact a professional financial adviser. Articles are current as at date of publication.
This website contains information and opinions provided by third parties. Inclusion of this information does not necessarily represent Morningstar’s positions, strategies or opinions and should not be considered an endorsement by Morningstar.