As Warren Buffett once said: “There seems to be a perverse human characteristic that makes easy things difficult.” This has particularly been the case with investing where complexity has multiplied with new products, new ways to access various investments, tax changes and new regulations, all with social media adding to the noise. But it’s really quite simple and this can be demonstrated in these charts and table.
#1 Time in the market versus timing the market
Source: Bloomberg, AMP Capital
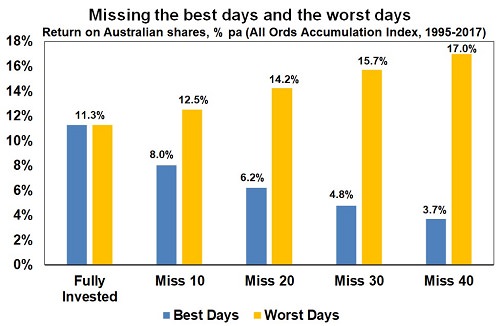
Without a tried and tested asset allocation process, trying to time the market, i.e. selling in anticipation of falls and buying in anticipation of gains, is very difficult. A good way to demonstrate this is a comparison of returns if an investor is fully invested in shares versus missing out on the best (or worst) days. If you were fully invested in Australian shares from January 1995, you would have returned 11.3% per annum (including dividends but not franking credits, tax and fees).
If by trying to time the market you avoided the 10 worst days (yellow bars), you would have boosted your return to 12.5% pa. If you avoided the 40 worst days, it would have been boosted to 17% pa. But this is difficult and many investors get out after the bad returns have occurred, just in time to miss some of the best days. For example, if you miss the 10 best days (blue bars), the return falls to 8% pa. If you miss the 40 best days, it drops to just 3.7% pa.
Key message: market timing is great if you can get it right, but without a tested process, the risk of getting it wrong is very high and if so it can destroy your returns.
#2 Look at your investments less
Daily and monthly data from 1995, data for years and decades from 1900.
Source: Global Financial Data, AMP Capital
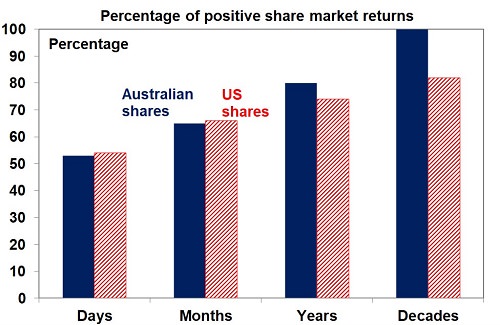
The daily movements in the share market are down almost as much as they are up, with slightly over 50% of days seeing positive gains. See the next chart for Australian and US shares. Day-by-day, it’s pretty much a coin toss whether you will get good news or bad news. But if you only look monthly and allow for dividends, the historical experience tells us you will only get bad news around a third of the time. Looking out further on a calendar year basis, data back to 1900 indicates the probability of a loss slides to just 20% in Australian shares and 26% for US shares. And if you go all the way out to once a decade, since 1900 positive returns have been seen 100% of the time for Australian shares and 82% for US shares.
Key message: the less you look at your investments, the less you will be disappointed. This matters because the more you are disappointed, the greater the chance of selling at the wrong time.
#3 Understand risk and return potential
Source: AMP Capital
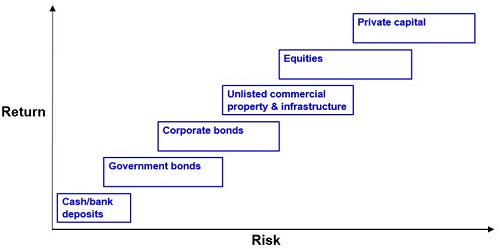
This chart is basic to investing. Each asset class has its own risk (in terms of volatility and risk of loss) and return characteristics. Put simply: the higher the risk of an asset, the higher the return you will likely achieve over the long term and vice versa. The next chart shows a stylised version of this. Each step up involves more risk and this is compensated for with more return.
Key message: Investors who don't mind short-term risk (and illiquidity in the case of unlisted assets) can take advantage of the higher returns growth assets offer over long periods, but there is no free lunch.
#4 The value of diversification
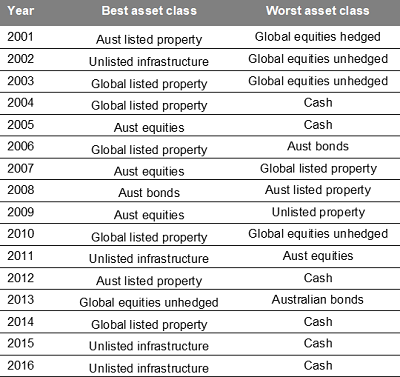
But this is not the end of the story. The next table shows the best and worst performing asset class in each year over the last 15 years.
Source: Thomson Reuters, AMP Capital
The best-performing asset each year varies with no pattern and last year’s top performer is no guide to the year ahead. For example, those who loaded up on listed property after their strong pre-GFC performances were badly hurt as they were amongst the worst-performing assets through the GFC. It makes sense to have a combination of asset classes in your portfolio, especially assets that are lowly correlated i.e. that don't just move in lock step with each other.
Key message: diversification is like the magic of compound interest, since a well-diversified exposure means your portfolio won't be as volatile. This can help you stick to your strategy when the going gets rough.
#5 The power of compounding (and residential property has a role)
Source: ABS, REIA, Global Financial Data, AMP Capital
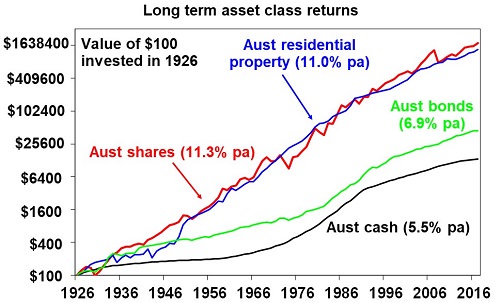
This chart highlights the power of compound interest, with a comparison showing the value of $100 invested in various Australian asset classes since 1926.
Over very long periods, the power of compounding works wonders for shares compared to bonds and cash. But it can also be seen to work well for Australian residential property with an average total return (capital growth plus net rental income) of 11% pa, which is similar to that for shares (while acknowledging that it's difficult to generalise about residential prices as every property is unique).
The key is to allow for the different ‘risks’ experienced by property versus shares. Property prices are less volatile than share prices as they are not traded on share markets and so are not as subject to the whims of investors. Movements in their values tend to relate more to movements in the real economy. But residential property takes longer to buy and sell and it’s harder to diversify as you can’t easily have exposure to hundreds or thousands of properties in different sectors and countries like you can with shares.
Key message: Given their long-term returns and diversification benefits, there is a key role for residential property in an investment portfolio (putting aside issues of current valuations).
Dr Shane Oliver is Head of Investment Strategy and Chief Economist at AMP Capital. This article is general information and does not consider the circumstances of any investor.