The CommBank Household Spending Insights (HSI) index tracks month-on-month data at a macro level and is based on de-identified payments data from approximately 7 million CBA customers, comprising roughly 30% of all Australian consumer transactions.
The following is an extract from the latest HSI report.
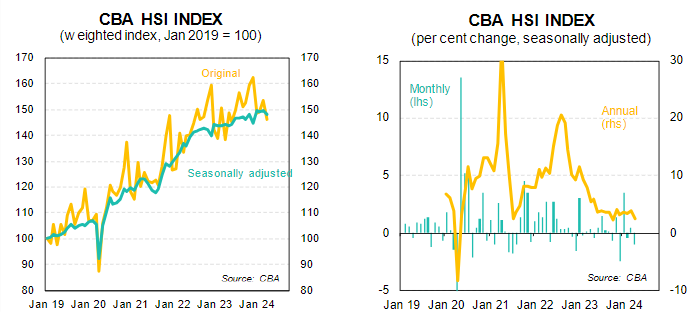
The HSI index for April 2024 declined by a significant 1.0%/mth in seasonally adjusted terms, to 148.1. The fall in April followed a gain of 0.4%/mth in March. At 148.1 the HSI index is down from the January 2024 peak of 149.7, indicating that household spending has weakened over the first four months of 2024.
For April, eight of the 12 HSI categories saw an increase in spending, led higher by spending on Education (3.7%/mth), Utilities (2.5%/mth) and Motor vehicles (1.7%/mth). However, this strength was more than offset by large falls in spending on Food & beverage (-3.8%/mth), Hospitality (-3.3%/mth) and Recreation (-2.6%/mth), as well as lower spending on Transport (-1.7%/mth).
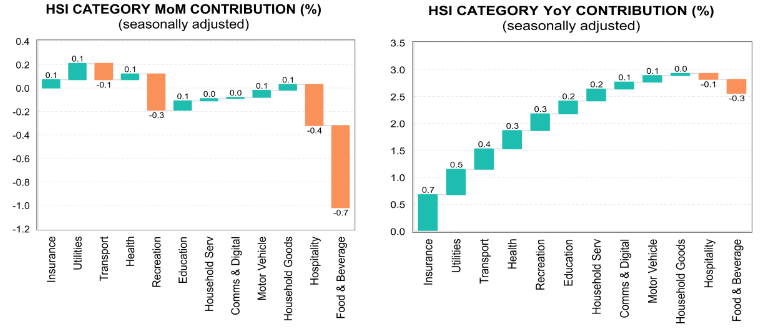
As can be seen from the chart on the left, the fall in Food & beverage spending had by-far the largest impact on the softer reading for April. The fall in Food & beverage spending in April came after a 2.1%/mth rise in March — reflecting the earlier-than-usual time of the Easter holiday in 2024. Similarly, reduced spending on Hospitality in April followed gains in March. In contrast, spending on Recreation has now fallen for three months in a row, after a strong gain in January 2024.
In the year to April 2024 the pace of increase in the HSI index slowed to down from 3.9%/yr in March. The 2.6% annual growth rate is the slowest pace of increase since October 2023. Over the year to April the strongest increase has been spending on Education (10.8%/yr), followed by Insurance (9.6%/yr) and Utilities (9.0%/yr). The weakest spending has been on Food & beverages (-1.4%/yr), Hospitality (-1.0%/yr) and Household goods (+0.3%/yr).
Results by State
SA and Tasmania (both 0.3%/mth) and NSW (0.1%/mth) bucked the national trend and saw an increase in spending in April. All other jurisdictions were lower, led down by NT (-1.7%/mth), Vic (-1.2%/mth), Qld (-0.9%/mth), ACT (-0.7%/mth) and WA (-0.2%/mth). In the year to April, the strongest state for Household spending is now Tasmania (4.0%/yr), followed by SA (3.7%/yr). Softer growth has been seen in Vic and the ACT.
- WA declined in April and has now slipped from its previous position as the strongest state. -0.2%/month +3.4%/year
- SA saw the equal strongest increase in spending in April and is one of the strongest jurisdictions over the past year. +0.3%/month +3.7%/year
- NT was the weakest jurisdiction in April, but is still running above the national average year to April. -1.7%/month +3.3%/year
- Tas saw a rise in spending in April and is now the strongest states for spending over the past year. +0.3%/month +4.0%/year
- Qld saw a decline in spending in April, with the annual growth rate decelerating. -0.9%/month +3.2%/year
- NSW spending edged higher in April, with the pace Of annual growth close to the national average. +0.1%/month +3.1%/year
- ACT spending was down in April, with the annual growth rate well below the national rate. -0.7%/month +1.1%/year
- Vic saw the second largest decline in spending in April and remains one of the weakest of all the states on an annual basis. -1.2%/month +1.9%/year
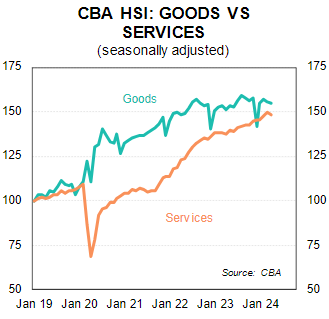
Goods v Services
- Goods spending declined by -0.8%/mth, in seasonally adjusted terms in April — following a -0.8%/mth fall also in March.
- Services spending was down -1.0%/mth in April in seasonally adjusted terms, but this came after a 1.4%/mth gain in March.
- In annual terms, Goods spending is up 2.4%/yr to April, while Services spending is up 7.7%/yr.
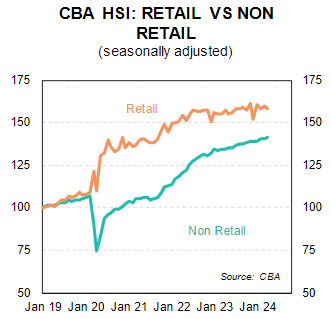
Retail v Non-Retail
- Retail spending fell by -1.1%/mth in April in seasonally adjusted terms, after a 1.0%/mth gain in March.
- Non-retail spending was up 0.4%/mth in April in seasonally adjusted terms, follow a 0.3%/mth gain in March.
- On an annual basis, Retail spending is up just 0.2%/yr in April, but non-retail spending is up a solid 5.3%/yr.
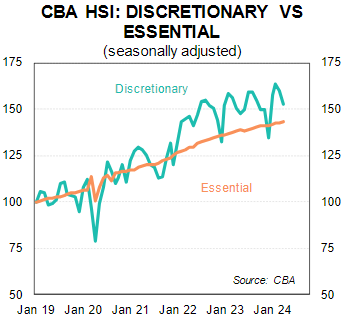
Essential v Discretionary
- Spending on Essential goods & services was up 0.5%/mth in April, after a 0.3%/mth gain in March.
- Spending on Discretionary items fell by a large -4.4%/mth in April, following a decline of -2.2%/mth gain in March.
- On an annual basis, spending on Essentials is up 4.0%/yr to April, while spending on Discretionary is up just 1.8%/yr.
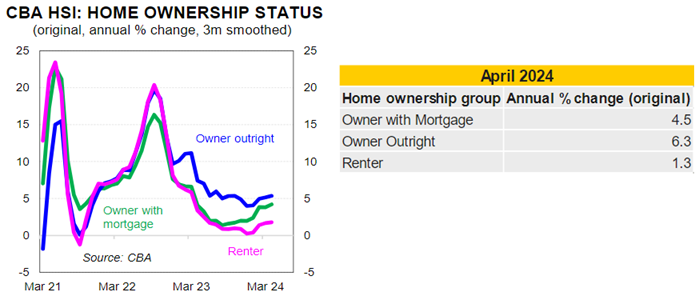
Home ownership insights
From April 2024 we introduce the CommBank HSI by home ownership status. We use a smaller subset of the data to split the HSI into three different home ownership types: Owner with Mortgage, Owner Outright and Renter.
This breakdown emphasises the challenging environment for those who Rent and those who have a Mortgage when compared to those that own their home outright.
Spending by renters have lagged their counterparts since late 2022 with the difference growing over the past year given the large lift in rents.
Mortgage holders are recording a lift in spending in between renters and those that own their home outright (ie without a mortgage).
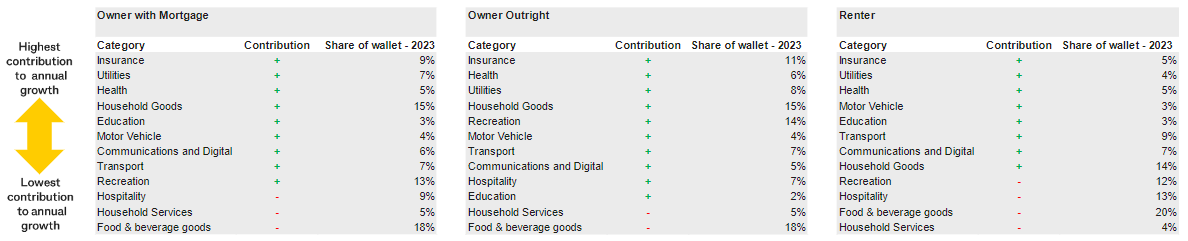
Owner with mortgage
- Insurance, utilities and health crowd the top three spots of contribution to spending for those with a mortgage, as it does for the other home ownership types.
- Over the past year those with a mortgage have reduced spending on hospitality, household services and food & beverage goods.
Owner outright
- Homeowners devote a large share of their wallet to insurance, health and utilities and these three categories have contributed the most to spending growth over the past year.
- Household goods and recreation make up the fourth and fifth spot in terms of positive spending contribution, while household services and food & beverage goods detracted from spending growth over the past year.
Renter
- The share of wallet for renters differs, with less spent on insurance, utilities and health. Renters typically devote a larger share of their wallet to hospitality and food & beverage goods.
- Renters have reduced spending on recreation, hospitality, food & beverage goods and household services over the past year.
click to enlarge
Stephen Halmarick is Chief Economist - Head of Global Economic & Markets Research, and Belinda Allen is a Senior Economist at Commonwealth Bank of Australia. This article is for informational purposes only and is not to be relied upon for any investment purposes. It has been prepared without taking into account your objectives, financial situation (including your capacity to bear loss), knowledge, experience or needs.