The 2019 Melbourne Mercer Global Pension Index gave the Australian retirement income system a B+ grade with a score of 75.3 and third place across the 37 different retirement systems that exist around the world.
From a global perspective this is a good result but clearly there is room for improvement as both the Netherlands and Denmark received an A grade with scores above 80.
Given that the Retirement Income Review is about to commence, it will be helpful to understand how the Australian system could achieve the coveted A-grade award.
The main ways to boost the rating
The biggest improvement in the Australian score requires a greater focus on income streams during retirement. Such a change, as recommended by the Financial System Inquiry, would not prevent the provision of lump sum benefits. Rather, the system needs to recognise and encourage both income products and the availability of lump sum benefits during retirement. This development was previously announced in the 2018 Federal Budget through the introduction of a retirement income covenant for trustees but we have seen no recent action.
The next improvement is to reduce the taper rate used in the age pension assets test from $3 per fortnight to $2.25 per fortnight. This change would increase the part pension payable to many retirees and thereby improve the adequacy of the total income received during retirement. Recently, the Government reduced the deeming rates used for the income test but made no change to the taper rate used for the assets test. The current taper rate is particularly severe in the current low interest rate environment.
The third improvement would be to raise the SG contribution rate from the current 9.5% to 12%. Naturally this would increase future superannuation benefits and improve the long-term sustainability of the Australian system. It’s also worth noting that several countries have mandatory contribution rates in excess of the current Australian rate. For example, the contribution rates in the Netherlands and Denmark are 15% and 12% respectively. These two countries also have a universal pension. No wonder they are well ahead of Australia.
The fourth action is to introduce a requirement that benefit projections be included on all member statements provided by superannuation funds. Such a requirement, especially if it had an income focus, would improve members’ awareness and understanding of their future retirement benefits and thereby allow better informed decisions.
These four changes would improve the Australian score by 3.7 to 79.0. Given the changes to the means tests for longevity products from July 2019, it is possible that Australia could reach 80, after taking into account the next round of OECD calculations as well as the above recommendations.
Some additional changes to go even further
The following four outcomes would also improve the Australian score by between 0.3 and 0.5 each.
The first is to raise the level of assets set aside for superannuation benefits from 137% to 150% of GDP. This increase is likely to occur in the next few years but would still place Australia behind the current level of assets in Canada, Denmark, the Netherlands and the USA.
Second, lifting the labour force participation rate for those aged 55-64 from 66.7% to 75% would improve the sustainability of our retirement income system as the period of retirement is shortened. During the last 10 years this participation rate has risen from 57% so further increases are feasible. However, even a rate of 75% would place us behind the current rates in New Zealand, Sweden and Switzerland.
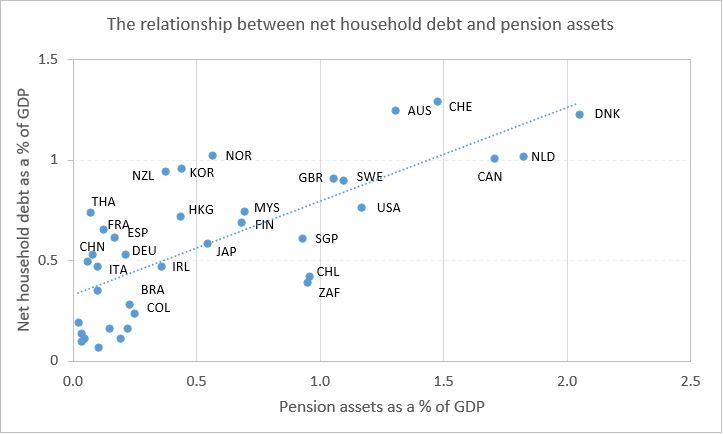
Third, increasing the household saving rate and reducing the level of household debt improves the net assets available for Australians in retirement, beyond their superannuation. Currently Australia has the second highest level of net household debt, expressed as a proportion of GDP, just after Switzerland. An increasing number of older Australians are now entering retirement with debt which naturally affects their future standard of living.
Fourth, Australia needs better integration between the age pension and superannuation. However, it’s also important to ensure that the overall system provides adequate benefits in a sustainable manner over the decades to come.
Debt and assets relationship
The 2019 MMGPI Report highlighted for the first time the relationship between net household debt and pensions assets. The following graph shows the relationship between these two variables, both expressed as a percentage of GDP. The relationship is strong, with a correlation of 74.4%.
There are likely to be several causes of this strong relationship but the well-known ‘wealth effect’ is probably a major factor in many economies. That is, consumers feel more financially secure and confident as the wealth of their homes, investment portfolios or accrued pension benefits rise. In short, if your wealth increases, you are more willing to spend and/or enter into debt.

The trend line in the graph has a slope of 0.466 which suggests that for every extra dollar in pension assets, net household debt increases by less than half that amount, on average.
With the growth in assets held by pension or superannuation funds, households feel more financially secure enabling them to borrow additional funds prior to retirement. Such an outcome is not a bad thing. The assurance of future income from existing assets enables households to improve both their current and future living standards. This situation stands in contrast to those countries where there is a heavy reliance on pay-as-you-go social security benefits which can be adjusted by governments thereby reducing long term confidence in the system.
Dr David Knox is a Senior Partner at Mercer. See www.mercer.com.au. This article is general information and not investment advice.