Investors often express their current views on markets by tilting their portfolios towards certain sectors, in hopes of generating excess returns. But what they may actually be looking for are companies with specific characteristics – or factors - that add portfolio resilience.
Sector classifications are useful for viewing companies in similar lines of business, but companies often have business lines that span multiple industries or sectors. For example, Amazon is one of the leading “FAANG” technology companies. It sells goods online, offers e-commerce services, streams music and video, produces media content, operates a cloud platform, has AI capabilities, sells consumer products like Kindle, Fire, Ring, Echo, and offers medical services. According to the Global Industry Standard (GICS) sector definitions, Amazon is not in the technology sector - it is defined as a consumer discretionary company. While sectors can provide a high-level understanding of similar businesses, sometimes these definitions are too blunt an instrument.
At the same time, economic forces can make some stocks expensive or cheap, experience winning or losing trends, and be exposed to financial stress for more highly levered companies – simultaneously affecting stocks across different sectors. Factor investing drills through broad labels to highlight what investors may care about and to help understand past performance and expected returns. These characteristics include absolute and relative price (size and value), the quality of a company’s earnings, trends in company performance (momentum), and the absolute and relative risk of a company (minimum volatility).
Factor returns
The five factors of value, quality, momentum, minimum volatility, and small size are all supported by empirical data and peer-reviewed research.1 These factors have not only shown positive excess returns or reduced risk in the initial research, but they have also survived out of sample. Historically, each of these five factors has outperformed its counterpart – large size, higher priced companies, less profitable firms, downward trending stocks, higher risk securities – over varying time periods.
Exhibit 1: % of periods that factor outperformed counterpart2
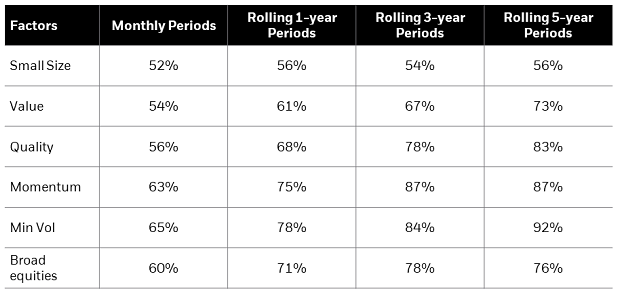
Source: Analysis by BlackRock using Ken French data library and AQR data set as of 1/31/23. Data from July 1963 through January 2023.
Investors can contrast factors with sectors or industries, which have not exhibited significant long-term excess returns above the market.3
Exhibit 2: Reward to risk ratio of factors compared to industries4
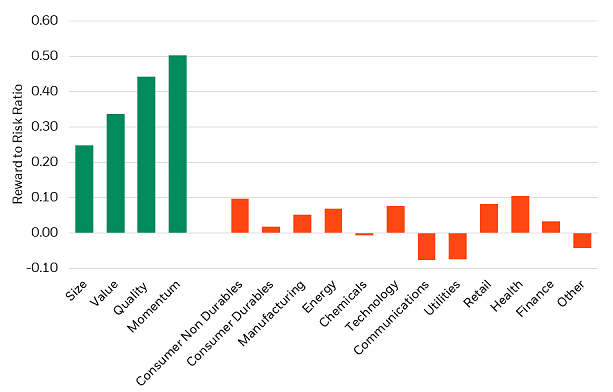
Source: Analysis by BlackRock using Ken French data library and CRSP database from July 1963 through April 2023.
There is not much evidence to support the idea that keeping a constant, strategic allocation to sectors will result in significant returns above the market average. On the other hand, factors have the potential to provide a long-term source of returns. Additionally, by adjusting the positions of factors over time, it is possible to generate returns in a way that complements adjusting the positions of sectors over time.
Factors premiums within sectors
Investors seeking to capture factor premiums can consider whether to take a sector constrained or unconstrained approach. For factors that rely on fundamental variables, like quality and value, it may be prudent to apply sector constraints. When using balance sheet and earnings statement data, sector-specific treatment of earnings or book value in constructing factors allow more consistent comparison of companies within each sector. Investors may desire high quality and lower priced stocks across all sectors without unintended sector bets.
It’s important to highlight that sector neutral does not equate to industry neutral. A focus on quality can lead to overweights within industries while still remaining sector neutral to the broad market. For example, within the financials sector, banks have often scored poorly on quality metrics due to their levered business models.
Exhibit 3: Sector neutral does not equal industry neutral
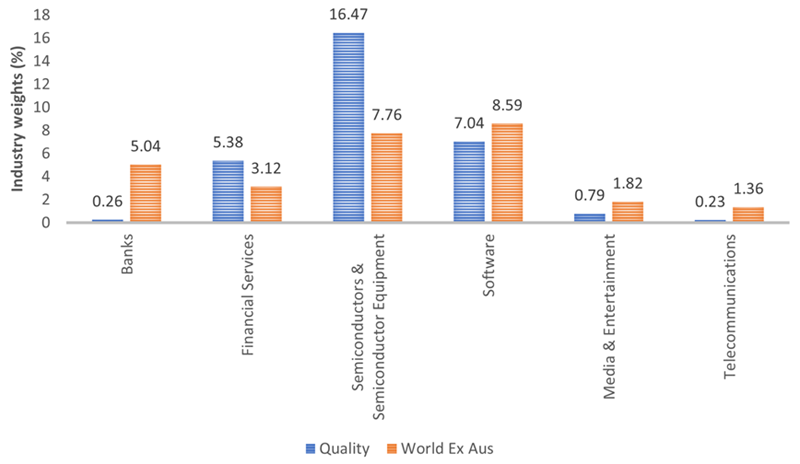
Source: BlackRock data as of 21/2/2024. Quality is represented by the MSCI World ex Australia Quality Sector Capped Select Index, World ex Aus represented by MSCI World ex Australia Index. *Indexes are unmanaged and one cannot invest directly in an index.
The MSCI World ex Australia Quality Sector Capped Select Index is constrained in how far it can move from the sector weightings in its parent index5 at each rebalance. As the index methodology considers leverage as one of its three quality screens (the other two are earnings variability and return on equity), the index was able to largely avoid the regional banking crisis in the US in 2023 stemmed by the collapse of Silicon Valley Bank. This was achieved by holding minimal bank exposure, while still remaining sector neutral within the financials sector.
Factors express a complementary view
The sector-controlled or sector-neutral definitions of factors can allow investors (e.g., institutional, adviser, end investor) who dynamically allocate to factors access to a complementary source of returns compared to investors doing sector rotation.
Traditionally, many active managers, asset allocators, and individual investors have expressed tactical views by rotating across sectors in hopes of generating alpha. In some cases, they want companies perceived to be “safe havens” such as utilities or consumer staples if they believe we are headed towards an economic slowdown or recession. In many cases, what these investors are actually looking for is exposure to companies with defensive characteristics that may add resiliency to their portfolios. They want companies that are less volatile (minimum volatility) or have lower amounts of leverage and more stable earnings growth (quality).
Exhibit 4: Sector rotation vs. factor tilting
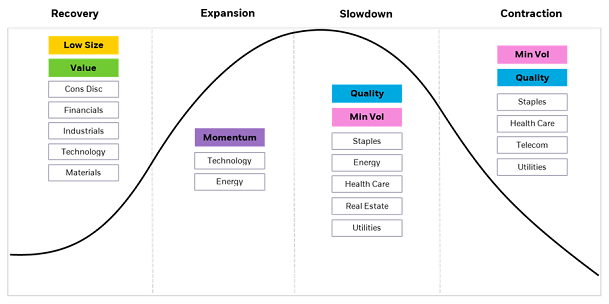
Source: BlackRock, 2023. For illustrative purposes only. 'This is not a recommendation to invest in any particular financial product.
Factors naturally align with how institutional class investors think about the market.
Investors that are able to evolve their views from traditional sector labels to factors may be able to express a complementary view in their portfolio – and more importantly, allow them to capture the underlying exposure they are seeking.
Conclusion
It’s not factors versus sectors. It’s factors and sectors.
Sector constrained implementation of factors, like value and quality, can allow investors to harvest a long-run rewarded factor return that is different from the returns of sectors. Likewise, factor rotation strategies can be used alongside sector rotation strategies as differentiating sources of returns.
In this new economic regime where inflation has been persistent and is still well above the norm across most global markets, real rates are significantly positive, geopolitical tensions are flaring, and government deficit to GDP ratios are at the same level as during World War II – investors could use all possible sources of diversification and return drivers in their portfolios. Using factors alongside traditional sector strategies can help provide additional diversification.
Andrew Ang is BlackRock’s Head of Factors, Sustainable and Solutions.
1 Fama and French, 1992, "The Cross-Section of Expected Stock Returns," Journal of Finance, vol. 47(2), pp. 427-465. Novy-Marx, 2013, “The Other Side of Value: The Gross Profitability Premium,” Journal of Financial Economics, 108(1), pp. 1-28. Jegadeesh and Titman, 1993, “Returns to Buying Winners and Selling Losers: Implications for Stock Market Efficiency”, Journal of Finance, vol. 48(1), pp. 65-91. Ang, Hodrick, Xing, and Zhang, 2006, “The Cross Section of Volatility and Expected Returns, Journal of Finance, vol. 61(1), pp. 259-299.
2 Low size represented by SMB (small minus big). Value represented by HML (high book-to-market minus low book-to-market). Quality represented by RMW (robust minus weak). Momentum represented by MOM (high prior returns minus low prior returns). Min Vol represented by BAB (betting against beta). Counterparts for low size, value, quality, momentum, and min vol are larger firms, higher priced stocks, less profitable stocks, downward trending stocks, and higher beta securities. Broad equities represented by Mkt-Rf which takes the return of equities and subtracts out the risk-free rate.
3 Fama and French, 1997, “Industry Costs of Equity”, Journal of Financial Economics, vol. 43(2), pp. 153-193.
4 Size represented by SMB (small minus big). Value represented by HML (high book-to-market minus low book-to-market). Quality represented by RMW (robust minus weak). Momentum represented by MOM (high prior returns minus low prior returns). Industries are represented by Consumer Non-Durables, Consumer Durables, Manufacturing, Energy, Chemicals, Technology, Communications, Utilities, Retail, Health, Finance, and Other. Industry returns are calculated as excess returns which measure the industry returns in excess of the market. Reward-to-risk ratio is calculated by taking the average return of each factor/industry and dividing by its volatility. A higher reward to risk ratio implies a higher historical return relative to volatility.
5 The parent index is the MSCI World ex Australia index
CLICK HERE FOR IMPORTANT INFORMATION: Issued by BlackRock Investment Management (Australia) Limited ABN 13 006 165 975, AFSL 230 523 (BIMAL).
This material provides general advice only and does not take into account your individual objectives, financial situation, needs or circumstances. Before making any investment decision, you should assess whether the material is appropriate for you and obtain financial advice tailored to you having regard to your individual objectives, financial situation, needs and circumstances. Refer to BIMAL’s Financial Services Guide on its website for more information. This material is not a financial product recommendation or an offer or solicitation with respect to the purchase or sale of any financial product in any jurisdiction.
Information provided is for illustrative and informational purposes and is subject to change. It has not been approved by any regulator.
This material is not intended for distribution to, or use by, any person or entity in any jurisdiction or country where such distribution or use would be contrary to local law or regulation. BIMAL is a part of the global BlackRock Group which comprises of financial product issuers and investment managers around the world. BIMAL is the issuer of financial products and acts as an investment manager in Australia.
BIMAL, its officers, employees and agents believe that the information in this material and the sources on which it is based (which may be sourced from third parties) are correct as at the date of publication. While every care has been taken in the preparation of this material, no warranty of accuracy or reliability is given and no responsibility for the information is accepted by BIMAL, its officers, employees or agents. Except where contrary to law, BIMAL excludes all liability for this information.
Any investment is subject to investment risk, including delays on the payment of withdrawal proceeds and the loss of income or the principal invested. While any forecasts, estimates and opinions in this material are made on a reasonable basis, actual future results and operations may differ materially from the forecasts, estimates and opinions set out in this material. No guarantee as to the repayment of capital or the performance of any product or rate of return referred to in this material is made by BIMAL or any entity in the BlackRock group of companies.
No part of this material may be reproduced or distributed in any manner without the prior written permission of BIMAL.
© 2024 BlackRock, Inc. or its affiliates. All Rights reserved. BLACKROCK, BLACKROCK SOLUTIONS, ALADDIN, iSHARES and the stylised i logo are registered and unregistered trademarks of BlackRock, Inc. or its affiliates. All other trademarks are those of their respective owners.