In the 1998 movie Sliding Doors, Gwyneth Paltrow’s character’s life splits into two parallel universes depending on whether or not she catches a train. The parallel universes that will be the focus of this article are the different outcomes that a member experiences based on their asset allocation choices.
Let’s assume we have a 50-year-old and the year is 2000. Their income is $75,000 per annum, increasing by 2% p.a. The starting balance in their super account is $200,000 and each year they contribute 9.25% of their income. Their investment choices are either an asset allocation to growth/defensive assets of 30/70 or 70/30. Which selection will result in the better outcome for the client?
Competing views on correct strategy
For the first 20 to 25 years of a client’s working life, their contributions to super dominate investment returns as the principal drivers of growth in balance. To quote former Treasurer Joe Hockey, the best thing that a client can do to grow their super balance over this period is to “get a good job that pays good money”.
However, once a client hits their mid-forties, investment returns dominate contributions as the key driver of growth. Further asset allocation is the dominant factor driving investment returns, having a bigger impact than either manager or security selection. Appropriate asset allocation becomes even more critical for this age group.
There are two competing schools of thought on the right thing to do later in life.
The first is the ‘risk off’ school which reduces exposure to equities to reduce volatility and the risk to retirement date. Lifecycle funds are an automated approach to implementing this glide-to-retirement approach.
The second is the ‘risk on’ school which maintains an exposure to equities to deliver reasonable returns to enable investors to build a sufficient balance for a comfortable retirement. This view is that moving clients into a low risk environment locks in low returns.
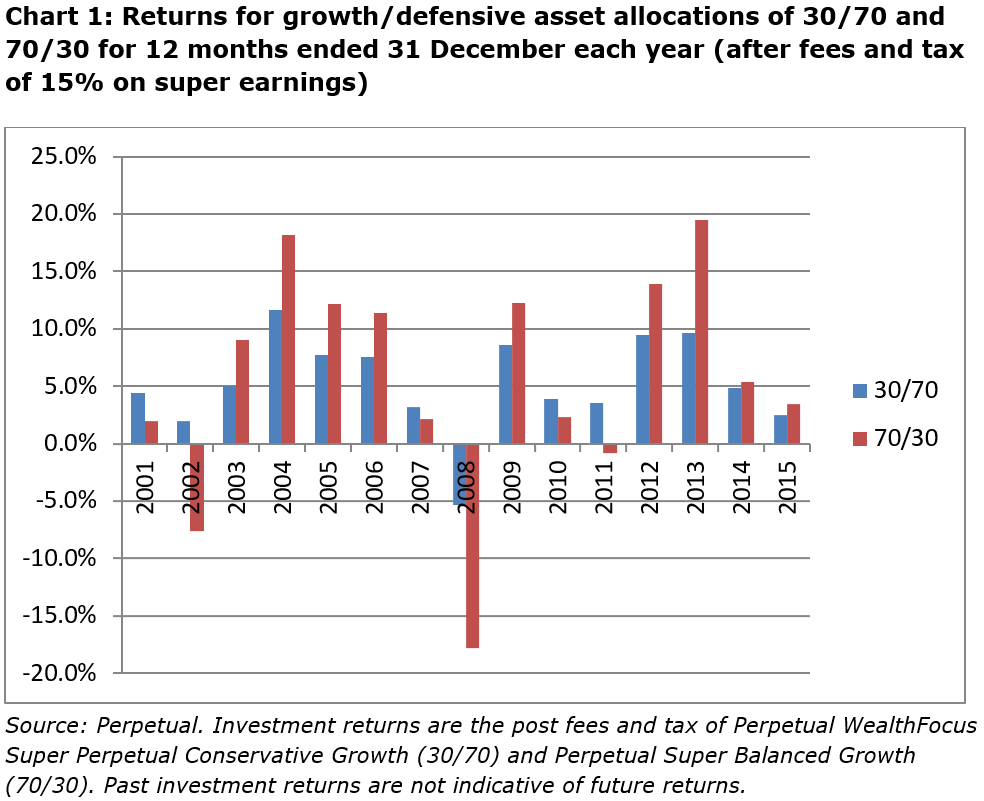
So let’s have a look at the returns of our 30/70 and 70/30 options from 2000 to now as shown in Chart 1.

Our 70/30 client’s experience is more like the Gwyneth Paltrow character’s universe where she catches the train, arrives home in time to catch her boyfriend cheating, starts her own PR firm and falls in love with John Hannah. The 70/30 client has experienced both the highs (annual return of 19.5% in 2013) and the lows (annual return of -17.77% in 2008). Alternatively, our 30/70 client has probably slept better at night with only one negative annual return (-5.37% in 2008) and a high of 11.62% in 2004.
How do the two strategies compare?
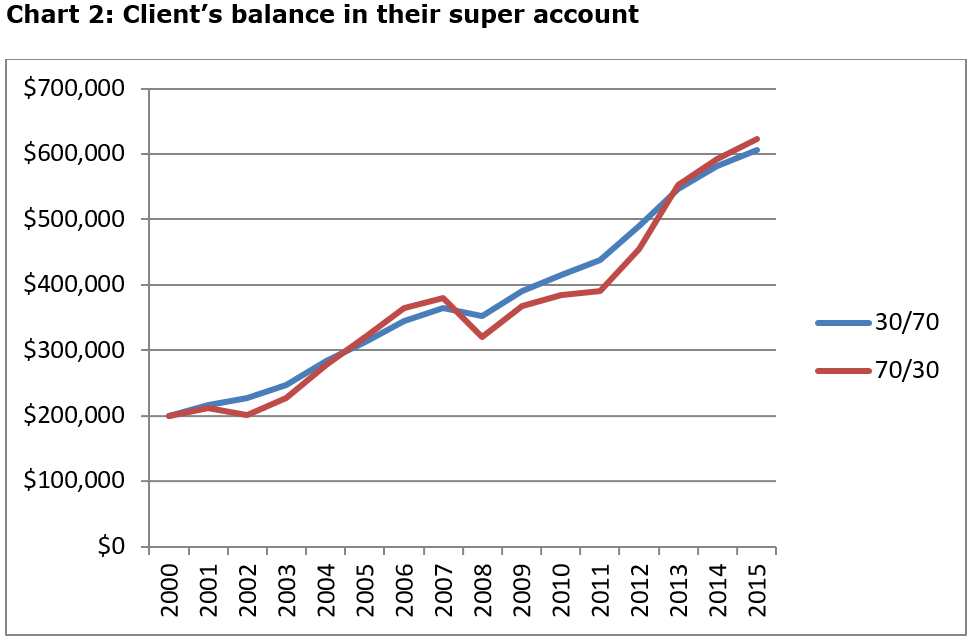
So how have these two alternative paths of returns flowed through to our client’s balance at retirement at the age of 65? Somewhat inconclusively the balance of the client at the end of 2015 is much the same regardless of which path the client took, as shown in Chart 2.

Over this period, the ‘risk off’ school could claim victory on the basis that the 30/70 path has delivered much the same level of return at a much lower level of volatility. The 30/70 asset allocation has delivered a superior risk adjusted return.
There is also some support for the 70/30 path. The client experienced the GFC seven years out from retirement, but still ended up slightly in-front at retirement in 2015. Over this period, while risk has not been rewarded, neither has it been punished.
Part of the decision on whether to reduce risk comes down to how equity markets perform over time. If each year’s return is essentially a random selection from a range of possible outcomes, then risk reduction is an important step to take.
However, if there is a relationship between year-on-year returns then long-term equity market returns may not be as risky as suggested by the volatility in 12-month return. Periods of bad returns tend to be followed by periods of better than average returns and vice versa. This can be seen over the 2000 to 2015 period with the tech wreck of 2002 being followed by strong returns from 2004 to 2006 and the GFC of 2008 being followed by the strong returns of 2012 and 2013. This view is that markets over react to both good and bad news, swinging between periods of under and over valuation.
Superannuation is the ultimate long-term investment strategy for an individual in that the timeframe is for the whole of the client’s life. The timeframe does not end at retirement, but continues (hopefully) for another 20+ years. If periods of poor returns are followed by periods of better than average returns, then clients have the capability (but not necessarily the willingness) to maintain exposure to risky assets as they approach retirement.
Asset allocation in the pension phase
The pension phase is complicated by the pension payments made from the member’s account. Let’s assume the member will have four alternate paths depending on their two asset allocation choices and two drawdown choices.
The member is 65-years-old and the year is 2000. They have accumulated a superannuation account balance of $500,000. They are commencing an allocated pension and have the choice of an asset allocation to growth/defensive assets of 70/30 or 30/70. Their desired income is 6% of their account balance, which they may choose to specify as a dollar amount (increasing by 2% p.a. for inflation) or as a percentage of their account balance.
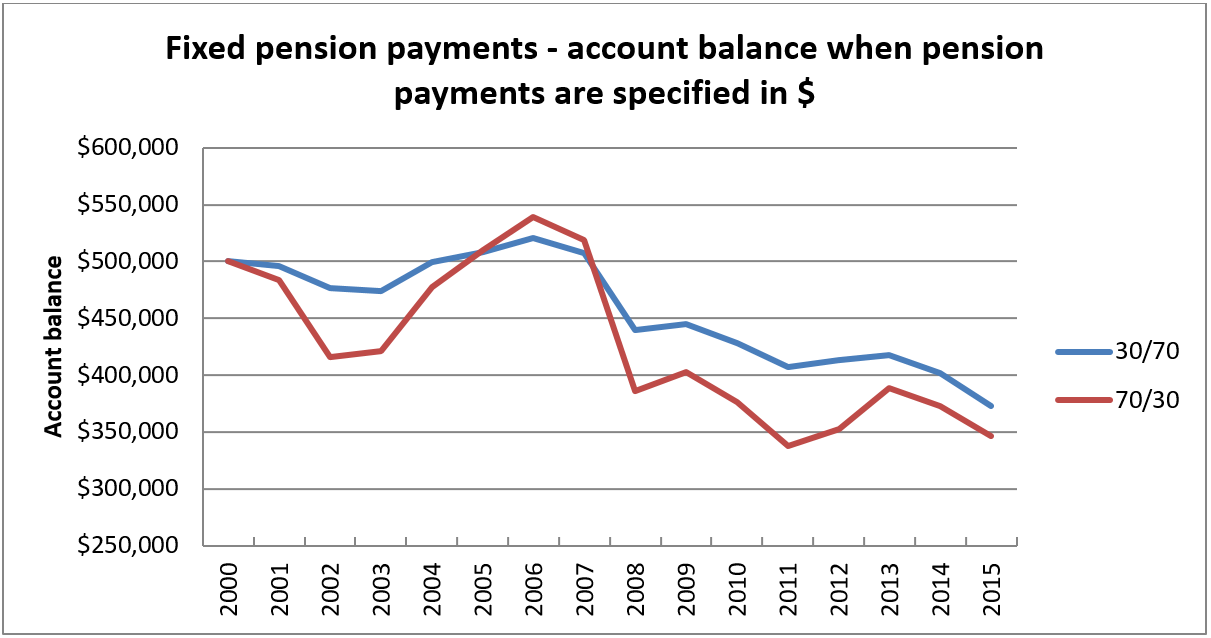
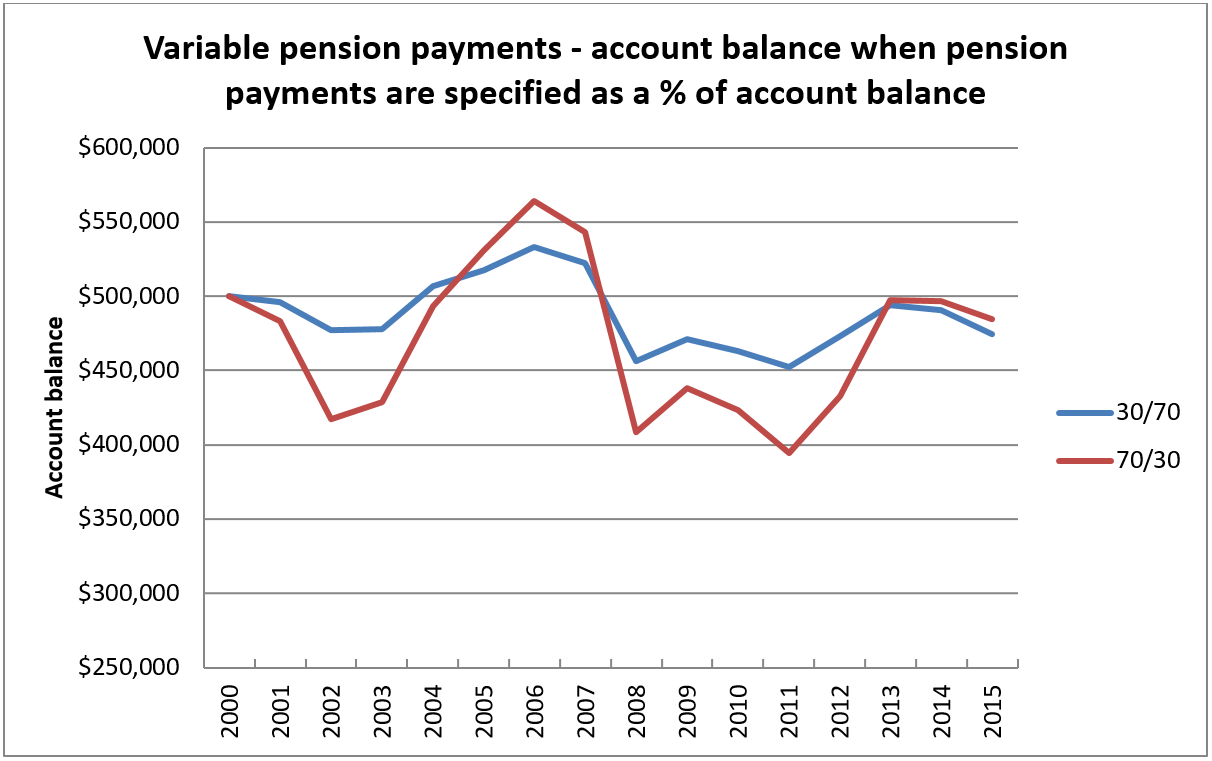
The member is invested in the pension equivalent of the funds described in Chart 1 above. The following two charts compare the impact of the returns on the client’s account balance when they are drawing a pension.

Pension payments specified as a set dollar amount, set initially as 6% of the member’s account balance in 2000. The dollar amount is increased by 2% pa for inflation.

Pension payments reset each year to 6% of the account’s balance.
A set pension payment with an asset allocation that results in volatile returns is not a good combination for the member. The member is better off with the lower risk 30/70 allocation. However, with the variable pension payments, the member is better off with the higher risk 70/30 allocation.
The reason is that specifying the pension payment as a set dollar amount results in a ‘reverse dollar cost averaging’ effect where more units are sold when markets are down and less when markets are up. The impact of this is greater the more volatile the returns.
Alternatively, specifying the pension payment as a percentage of account balance works as an automatic stabiliser. Pension payments are lower when markets are down and higher when markets are up. This works in favour for members holding more volatile investments in terms of preserving their remaining balance.
Pension drawdown method affects asset allocation decision
Therefore, the method of pension drawdowns has an impact on the asset allocation decision. For clients requiring the certainty of income of a specified dollar amount, the exposure to growth asset should be reduced. For clients with the capacity and willingness to accept some volatility in income by specifying their pension as a percentage of account balance, a greater exposure to growth assets may be appropriate.
Gordon Thompson is Senior Product Manager Platforms at Perpetual Investments. This article is general information and does not consider the circumstances of any individual.