Building an investment portfolio is akin to building or renovating a house. You have a dream home in mind, but there are practical issues to consider - budget, compliance, design and construction challenges. You may love the dream, but those are real-world parameters you can’t ignore.
Similarly, if you want your investment portfolio to help you achieve your goals in life, you need to keep a whole range of variables and often opposing practicalities in mind.
This article presents a framework for thinking about these challenges, using the interplay between risk, return, time horizon and the likelihood of negative returns for different asset allocation profiles.
The analysis is based on 30 years of rolling monthly returns to 30 June 2024, and incorporates the most common asset allocation profiles we use among our clients. These various growth/defensive portfolio splits are 60/40, 75/25 and 85/15.
This is important because your decision on asset allocation, specifically the mix of growth and defensive assets, is pivotal. In fact, it can drive 94% of your return - according to the often-cited 1986 study “Determinants of Portfolio Performance” by Brinson, Hood and Beebower.
So let’s get into the detail and look at how these different allocations work.
Asset allocation profiles

Each asset class here has a specific role to play relative to the portfolio objective. For example, the Balanced portfolio is typically more appropriate for those in need of cashflow – hence the greater allocation to shorter duration, floating rate credit and cash.
Conversely, the High Growth portfolio is built to deliver capital growth, and therefore its defensive portion is designed to protect against equity market volatility.
Controlling the controllable
Markets are inherently uncertain and none of us has a crystal ball. For all the pundits forecasting the trajectory for interest rates or the impact of the US election on markets, there are others who admit they know what they don’t know, accept the uncertainty and focus on the controllables.
One thing you can control is building an efficient and durable portfolio – one that is based on sound investment principles; one that is aligned to your objectives, horizon and risk appetite; and one designed to give you the best chance of meeting your goals while controlling for risk along the way.
Diversification across asset classes is foundational to this approach. It will not only determine your return but will allow you to minimise volatility.
The table below shows the returns and risk of key asset classes over the same 30-year period (included as a reference point relative to risk/return for the asset class profiles).

The risk-return relationship
The relationship between return and risk should be your starting point. To achieve higher returns, you need to take on greater risk. To take on more risk, you need more time.
To demonstrate this, look at the table below, which references rolling monthly annual returns. As expected, the returns increase incrementally from left to right. So far, so good. But note:
Relative to the volatility shown in the table above, the asset class profiles have meaningfully less volatility than the growth asset classes (shares, property and infrastructure). For example, High Growth returns slightly lag Australian shares (9.1% v 10.1%), but it delivers a material reduction in volatility (10.9% v 14%). That is the power of diversification.
Note also that the increase in standard deviation (the volatility of returns) is relatively more than the increase in return as you move from Balanced to Growth to High Growth. In other words, the relationship between return and risk is non-linear.

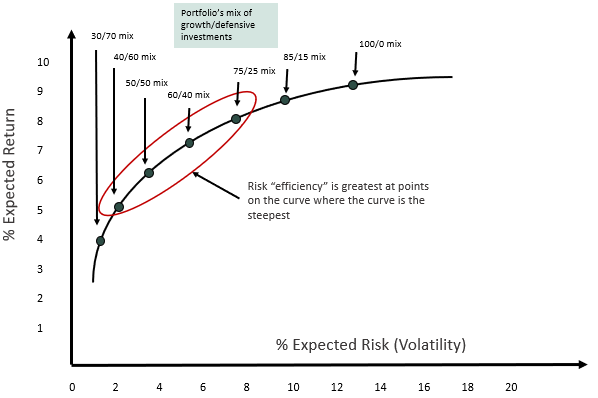
To show this another way, let’s look at the “efficient frontier”.
The chart below plots a series of portfolios from those with less expected risk/volatility (and therefore lower expected returns) to those with a greater allocation to growth assets such as the 85/15 portfolio, which exhibit higher returns and greater risk. Optimal portfolios sit on the curve (the frontier) and are optimised to maximise expected return for a given level of risk or conversely, minimise risk for a given level of expected return.

Note: Not to scale, for illustrative purposes only
You can see that risk “efficiency” is greatest where the curve is the steepest. Here, you expect relatively higher return for taking on incremental risk. But as the curve flattens out at a greater allocation to growth assets, the opposite occurs – you need to take on relatively more risk for incremental return.
This means finding that optimal mix is an important consideration. It influences not only headline returns, but the amount of risk required to achieve those returns. Yes, taking on additional risk beyond the 75/25 portfolio brings additional return, but it comes at a price.
Time is of the essence
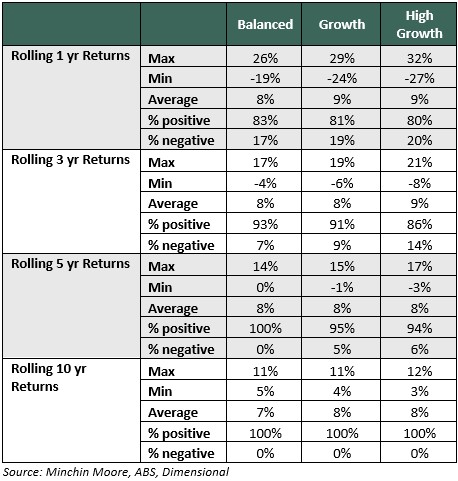
Your time horizon and allocation to growth assets are directly correlated. For a growth objective, you need more time for the portfolio to withstand inevitable volatility. The higher the allocation to growth assets, the more probable there will be extended periods of negative returns.
The table below shows the maximum, minimum and average return for the rolling monthly data series – across different periods and asset allocation profiles. It also shows the likelihood of a negative return over those periods.

Note there are zero instances of negative returns over a 10-year time period for all asset allocation profiles. Over a shorter period, there is a marked difference between the profiles – the likelihood of a negative return for High Growth over three years (14%) is double the Balanced profile (7%).
Two key lessons here: First, your time horizon matters. Time allows portfolios to grow and compound. During drawdowns, time allows portfolios to recover. The deeper the drawdown, which is directly correlated to the allocation to growth assets, the more time it needs to recover.
Second, discipline matters. Our experience is the trauma of sustained negative periods can encourage emotional and counter-productive decisions among some investors. But those armed with discipline and a well-constructed investment framework are better equipped to weather the storm.
Conclusion
Building a portfolio is like building a house. You need a framework that starts with clarity on your goals, time horizon and risk tolerance.
- Construct a portfolio with the right growth/defensive mix relative to that plan. Don’t ignore risk – you can give up some return and dampen volatility meaningfully by diversifying across asset classes.
- Focus on the controllables – the plan itself, diversification, and keeping your costs down. Focus more on what you know (as opposed to what you think might happen) and what this historical data tells you.
- Discipline matters. The investing concepts here are straightforward. Keeping your nerve is the hard part - don’t be distracted and let your emotions overrule the plan.
Jamie Wickham, CFA is a Partner at Minchin Moore Private Wealth and former managing director, Morningstar Australia.