Universal superannuation became an embedded component of the savings and wealth accumulation of workers some 21 years ago; a coming-of-age in 2014, so to speak. Only retired, non-working and some self-employed households missed out on the compulsory saving as part of employee’s remuneration, although voluntary contributions were to rise as well.
Of course, Life Offices had been offering retirement benefit packages for a long time in the form of industrial (weekly payments), ordinary (monthly payments) and superannuation type policies, of which only the last mentioned is of any significance today.
And government employee retirement benefits had also been around for many decades, usually unfunded, with retirement benefits paid out of current government receipts from taxes and Government Business Enterprises surpluses. That unfunded legacy is with us today, but addressed to some extent by the Howard/Costello Government while it was in office via the Future Fund.
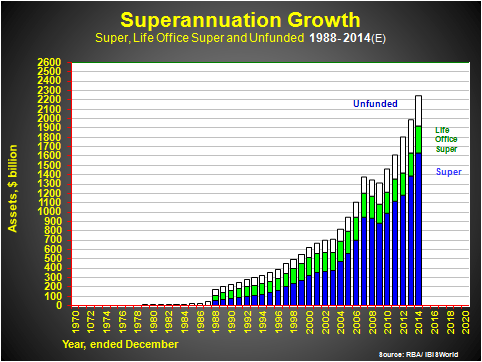
The first chart shows the spectacular growth of superannuation assets, only temporarily reversing for two years during the onset of the GFC.

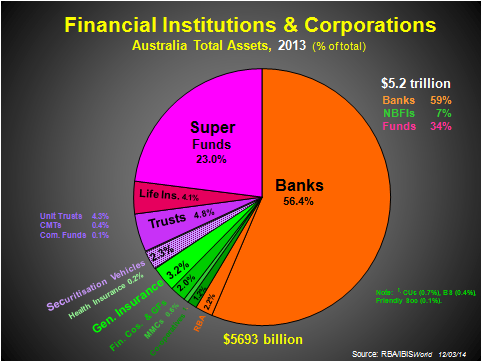
Assets will pass $2.2 trillion this year, from less than $100 billion 30 years ago. They will account for nearly 30% of the total assets of all financial institutions by the end of 2014, with banks diluted from an 80% lion’s-share of all assets up to 1940, to around 55% today. Still dominant. The second exhibit provides perspective in this regard.

At the end of 2013, approaching half the superannuation assets were in local shares (where they control nearly 60% of the ASX by capitalisation), 17% in overseas assets (including shares), 14% in bonds and other securities, 13% in cash and deposits, and the balance in property and other assets.
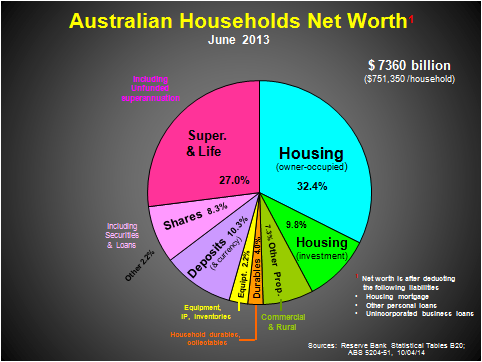
Clearly, superannuation has become an important part of household net worth as the third exhibit highlights.
At 27% of average household net worth of $751,000 in mid-2013, it is well ahead of investment property (16%) and is likely to overtake the value of owner-occupied housing (32%) soon.
Indeed, financial assets in total – including super, shares and deposits – are poised to overtake all hard assets (property, equipment and durables) within a few years. Some 25 years ago, financial assets represented 35% of net worth (including 11.4% in super). By the end of this year, the ratio will be over 50% with 24% in super.
This is a very positive development, as hard assets only yield a modest rental return plus capital gain, and never match the returns from active assets, notably shares.

So how much super does one need to have to be able to retire independent of the pension and with dignity? Twice as much as the average home, meaning that a home should no longer be regarded as the biggest investment of one’s life, as was the claim for much of the post-WWII years (although with a wide diversity of property values, every person’s position is unique).
Average household income for the 9 million+ households of the nation will be just over $150,000 by the end of 2014: yes, surprising as that figure is. It is suggested that retiring on a one-third share of average household income is a desirable goal. In turn, this would suggest a nest egg of around $830,000 taking out 6% each year and leaving enough to grow the capital in line with inflation.
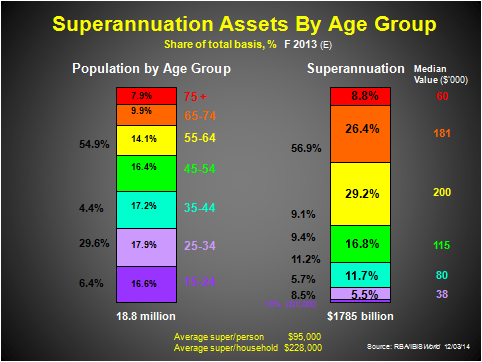
Currently average super sits at around $100,000 per person or $240,000 per household in 2014, but this includes young people and households as well as retired ones. So a look at the differences across age groups is helpful in seeing how close we are to ‘dignified retirement’ at present, as the final exhibit shows.

It suggests that recent retirees (aged 65-74) have a median value of super of $181,000 per person, or around $360,000 per household, or 40-45% of the ‘dignified retirement’ level. The even-older households are generally pensioners, with less than $75,000 per household in super (much of it via Life Offices).
Being averages, a minority of these age groups live comfortably, but most - perhaps over two-thirds - would be living a more abstemious lifestyle.
The younger Baby Boomers are currently the best-off in super, with over $400,000 per household and the capacity to improve on that level with a continuing working life for a decade or more. Their average could edge up towards 55-60% of the desirable level if they work long enough. Again, some retirees in this age bracket will easily reach a comfort zone. Generally, only a third or so of Baby Boomers (49-71 years) will retire with their wished-for comfort and dignity.
So, it is not all that salubrious, reminding us that we have a long way to go. It will take at least two generations (of an average of 20 years each) from 1993 to achieve the desired level of comfort for retirees. The Net Generation (12-32 years old) and the youngest of the Gen Xers (33-48 years old) are the first of the retirees likely to be comfortable. In theory, provided they have super and assuming no interim catastrophes and set-backs. But we are on the way, and leading the world.
Phil Ruthven AM is Chairman of IBISWorld.