Register For Our Mailing List

Register to receive our free weekly newsletter including editorials.

Home / 444

Bank hybrids response to equity market weakness

What’s the relationship between hybrids and equities when equity markets are weak? Probably the best comparison are the couples that appear on the Bachelor/Bachelorette: it’s ‘complicated’. There’s almost no correlation between the two assets most of the time, but sometimes there is and sometimes it can be material.

Price markdowns on bank hybrids and bank shares

The chart below details the drawdowns (markdowns in prices) for the Elstree Hybrid Index (Banks Series – yellow line) with the S&P/ASX200 Banks Accumulation Index (source IRESS – blue line).

Banks are actually a bit more volatile than the All Ordinaries Index but the bank index is a better like-for-like comparison. At the time of writing, bank shares are around 10% off their highs and hybrids are weaker by around 0.60%. If you are into statistics, that’s a 1 standard deviation move for both markets. You get worse than that most years.

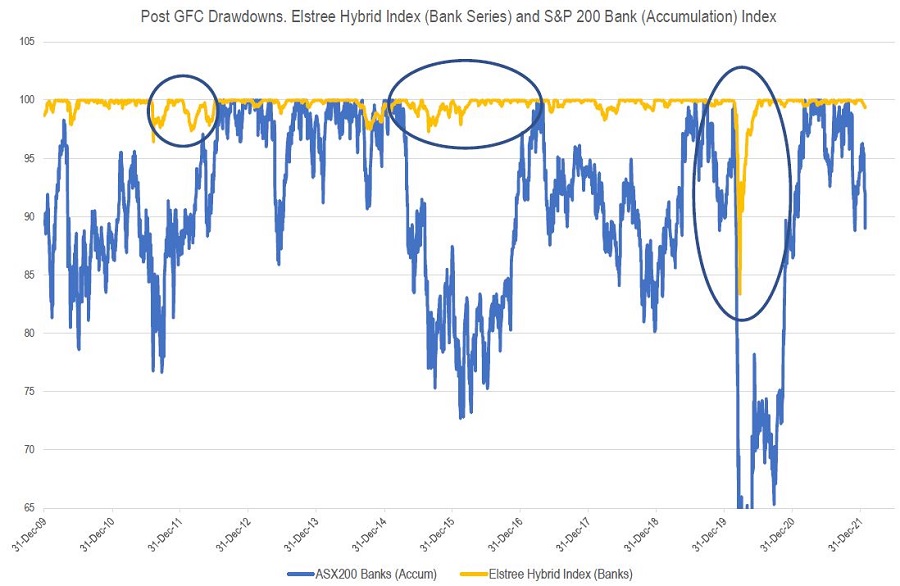
The three circled areas are the periods of material weakness since the GFC and there are some common factors for each of those periods which aren’t present to date in the current sell off:

  • Fears of material economic slowdown/economic chaos (China slowdowns, Euro bank problems, Greece, Covid, etc)
  • Protracted equity market weakness
  • Big drawdowns. Bank equities had to have sold off by more than 15%.

This sell off is not echoing the previous three. It’s an inflation/too fast growth/interest rate led sell off and so far, it’s only around 10%. At this stage, it looks like normal noise for hybrids. We might see another 0.5% - 1% weakness before we get a full recovery, or this might be the bottom if equity markets stabilise.

Nothing to see on credit margins yet

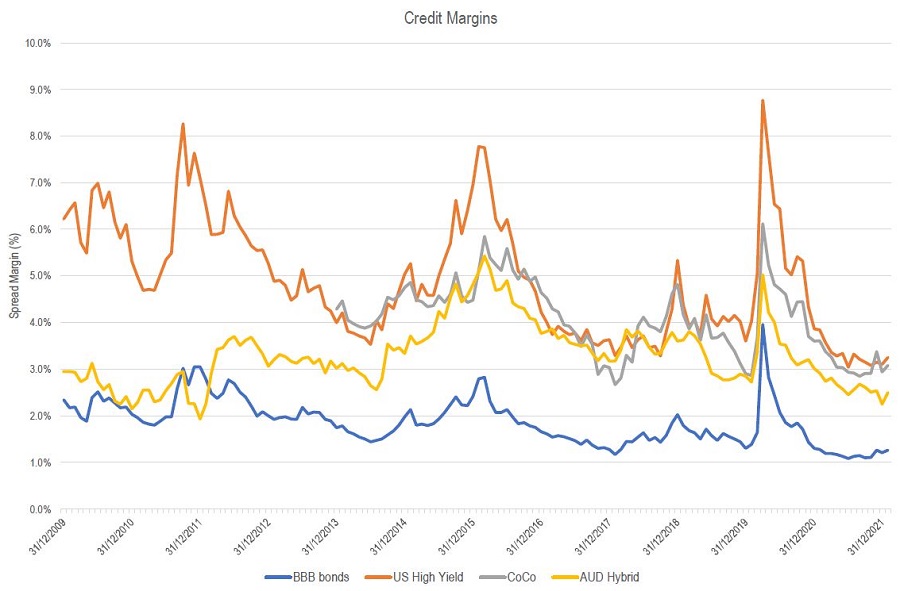
The chart below gives a longer-term perspective of credit margins (source BofA/ICE, Elstree) for four types of credit investments: ‘BBB’ rated bonds, High Yield bonds, CoCo (non AUD AT1/hybrids) and Australian AT1/hybrids. The last data point is 26 January 2022.

Will the last month lead to a surge in defaults down the track?

That would be nasty. We would be adjusting hybrid portfolios if we thought defaults were coming.

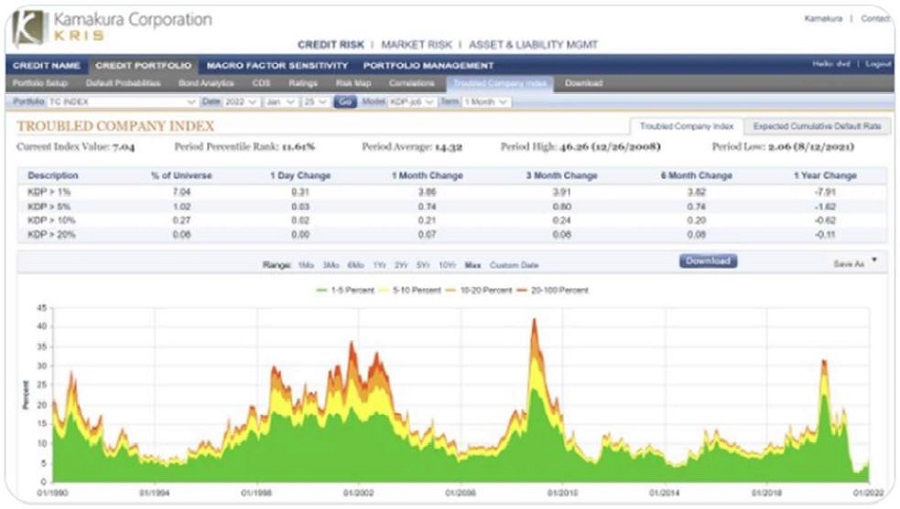
But at this stage it’s a non-event. Our favourite indicator is the Kamakura Troubled Company Index (source Kamakura). The index details the proportion of companies globally in various degrees of difficulty. While it’s a black box model, with its major inputs being equity markets and volatility, it has been extremely accurate predictor of default activity with a 12 month lead time. Credit conditions are still in the 11% of best periods since 1990, despite the month of market falls and its 1/3 as scary as what happened during Covid. There’s no default threat yet. The chart below is the 26 January 2022 update.

Why you own hybrids

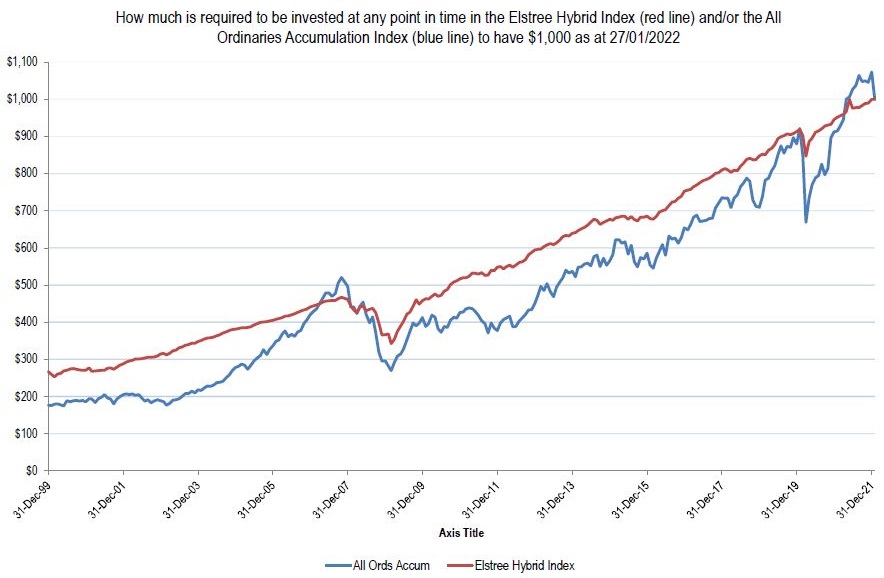
Here's our favourite chart that gives a rationale for investing in hybrids. It shows the amount (in dollars) you need to invest in the hybrid (red line) or equity market (blue line) at any one time over the past 21 years to have $1,000 today. Clearly, a lesser amount is better.

If you invested in our funds, the amount invested to have $1,000 today is even lower than that of the benchmark hybrid index.

The key takeaway is the delivery of similar return outcomes with lower risk. If you wanted to cherry pick data points, hybrids have outperformed equities since 2007 and also since just pre Covid. If you bought equities at the bottom of the Covid drawdown, you would have outperformed, but in general, hybrids have been great for much of the past 14 years. We think that is still a valid reason to invest in the asset class.


Norman Derham is Executive Director of Elstree Investment Management, a boutique fixed income fund manager. This article is general information and does not consider the circumstances of any individual investor. Elstree's listed hybrid fund trades on ticker EHF1. 


2 Comments
Campbell Dawson
February 02, 2022

Doug We've published the pre GFC drawdowns in another article: you can google it if you need to. The brief summary is that bank hybrids experienced an 18% drawdown which is almost entirely explainable by the capital losses from margins increasing from the 1% level we saw prior to the GFC to 5.5% (which is where they have topped out in the other very weak periods). If margins increased from the current 2.75% to 5% over the next year your capital loss would be c6.5% offset by 3% income , so a drawdown of c3.5%. There are other differences. Banks have doubled their capital since the GFC and prices of some bank hybrids in the GFC reflected a fear that they would not be redeemed. All these make using the GFC experience problematic. Returns. Hybrids are almost entirely floating rate so there has been no benefit from falls in interest rates. We've also published research that if you compare returns of equities to bonds over almost any long period, they rarely produce returns of greater than 2% better than the 10 year bond at the time you start your comparison. If that repeats, margins of c3% on hybrids may continue to provide returns that are comparable to equities. Thanks for the comments and for reading the article

Doug Turek
February 02, 2022

Terrific charts but is there some reason why they couldn't have started in 2001 when apparently you first created your useful Elstree Hybrid Index? It seems the key event of the GFC is missed and it would be useful to see the drawdown then. Also, well done comparing a hybrid to an equity in your last chart, as most compare hybrids to fixed interest investments. Of course a problem looking backwards with any fixed interest investment returns, is that they enjoyed wonderful starting high yields and won't today (ie. the 10 yr bond yield was 8% in '00 (hybrid 10%?) and is under 2% now and indebtedness limits its rise). Often the best predictor of future returns of a fixed income investor is the current yield (definitely not past performance) so perhaps one should just compare the current yield of the All Ords and hybrids. Your last chart is great but I question you can infer they will keep up with All Ords because they did. Put similarly I suspect a 30 year old fixed rate Gov't bond bought in 2000 would also have beaten the All Ords but a new one now only offers a prospective a 3% pa return for 20 years.


Leave a Comment:

RELATED ARTICLES

Hybrids throwing up opportunities … and risks

banner

Most viewed in recent weeks

Meg on SMSFs: Clearing up confusion on the $3 million super tax

There seems to be more confusion than clarity about the mechanics of how the new $3 million super tax is supposed to work. Here is an attempt to answer some of the questions from my previous work on the issue. 

Welcome to Firstlinks Edition 566 with weekend update

Here are 10 rules for staying happy and sharp as we age, including socialise a lot, never retire, learn a demanding skill, practice gratitude, play video games (specific ones), and be sure to reminisce.

  • 27 June 2024

Australian housing is twice as expensive as the US

A new report suggests Australian housing is twice as expensive as that of the US and UK on a price-to-income basis. It also reveals that it’s cheaper to live in New York than most of our capital cities.

The catalyst for a LICs rebound

The discounts on listed investment vehicles are at historically wide levels. There are lots of reasons given, including size and liquidity, yet there's a better explanation for the discounts, and why a rebound may be near.

The iron law of building wealth

The best way to lose money in markets is to chase the latest stock fad. Conversely, the best way to build wealth is by pursuing a timeless investment strategy that won’t be swayed by short-term market gyrations.

How not to run out of money in retirement

The life expectancy tables used throughout the financial advice and retirement industry have issues and you need to prepare for the possibility of living a lot longer than you might have thought. Plan accordingly.

Latest Updates

Investment strategies

Investors are threading the eye of the needle

As investors cram into ever narrower areas of the market with increasingly high valuations, Martin Conlon from Schroders says that sensible investing has rarely been such an uncrowded trade.

Economy

New research shows diverging economic impacts of climate change

There is universal consensus that the Earth is experiencing climate change. Yet there is far more debate about how this will impact different economies across the globe. New research sheds more light on the winners and losers.

SMSF strategies

How super members can avoid missing out on tax deductions

Claiming a tax deduction for personal super contributions can end in disappointment if it isn't done correctly. Julie Steed looks at common pitfalls and what is required for a successful claim.

Investment strategies

AI is not an over-hyped fad – but a killer app might be years away

The AI investment trend looks set to continue for years but there is only room for a handful of long-term winners. Dr Kevin Hebner also warns regulators against strangling innovation in the sector before society reaps the benefits.

Retirement

Why certainty is so important in retirement

Retirement is a time of great excitement but it is also one of uncertainty. This is hardly surprising given the daunting move from receiving a steady outcome to relying on savings and investments.

Investment strategies

Have value investors been hindered by this quirk of accounting?

Investments in intangible assets are as crucial to many companies as investments in capital equipment. The different accounting treatment of these investments, however, weighs on reported earnings and could render ratios like P/E less useful for investors.

Economy

This vital yet "forgotten" indicator of inflation holds good news

Financial commentators seem to have forgotten the leading cause of inflation: growth in the supply of money. Warren Bird explains the link and explores where it suggests inflation is headed.

Sponsors

Alliances

© 2024 Morningstar, Inc. All rights reserved.

Disclaimer
The data, research and opinions provided here are for information purposes; are not an offer to buy or sell a security; and are not warranted to be correct, complete or accurate. Morningstar, its affiliates, and third-party content providers are not responsible for any investment decisions, damages or losses resulting from, or related to, the data and analyses or their use. To the extent any content is general advice, it has been prepared for clients of Morningstar Australasia Pty Ltd (ABN: 95 090 665 544, AFSL: 240892), without reference to your financial objectives, situation or needs. For more information refer to our Financial Services Guide. You should consider the advice in light of these matters and if applicable, the relevant Product Disclosure Statement before making any decision to invest. Past performance does not necessarily indicate a financial product’s future performance. To obtain advice tailored to your situation, contact a professional financial adviser. Articles are current as at date of publication.
This website contains information and opinions provided by third parties. Inclusion of this information does not necessarily represent Morningstar’s positions, strategies or opinions and should not be considered an endorsement by Morningstar.