One of the most important, but difficult, aspects of long-term investing is learning to not let day-to-day market chatter and scaremongering media headlines affect your long-term strategies. Although I keep a close eye on financial markets daily (mainly to respond to a daily email inbox full of panicking punters), I look at my own long-term portfolio only once or twice per year, typically during the January break, and at financial year-end.
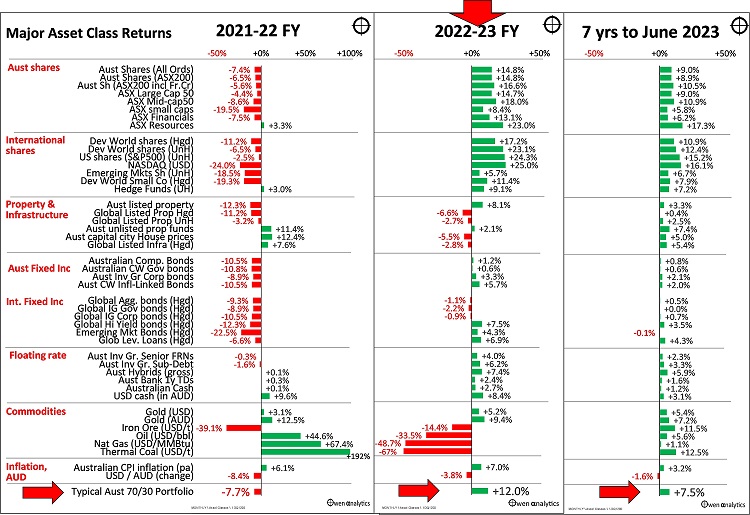
Looking through the day-to-day volatility and market chatter, the charts below show returns from the main asset classes for the 2022-23 financial year (middle chart), plus some other related data (commodities prices, inflation, exchange rate – in the lower section).

Click to enlarge
In the upper two sections of the middle chart, we see that in the 2022-23 financial year to June, share markets posted double-digit gains (with the best gains in recession-plagued Europe), while real estate markets (including housing) were hurt by rising interest rates, and bonds were more or less flat.
It is notable that returns on all asset classes were much better in 2022-23 than in the prior (2021-22) financial year, despite the fact that 2022-23 was the year of high inflation, aggressive interest rate hikes, quantitative tightening, crises in US regional banks and Switzerland, global slowdown fears, recessions in Europe, and declining global profits.
Diversified portfolios
The bottom line on each chart shows returns on a typical Australian diversified ‘70/30’ portfolio (70% ‘growth’ and 30% ‘defensive’ assets, which is in line with most large Super fund ‘Growth’ options, and also commonly their ‘default’ funds). In our hypothetical 70/30 portfolio, the ‘growth’ side has an even mix of Australian and international shares, with 50% currency hedging.
The ‘defensive’ side has Australian and international fixed income (bonds), plus 5% allocation to 1-year bank TDs, and 5% in cash, to negate ‘sequencing risk’ - ie a couple of years of living expenses in cash and short-term TDs so we don’t need to sell assets when asset prices are down.
These are just the basic asset classes, and each can be bought at very low cost by ordinary investors using ASX-listed ETFs, and/or unlisted passive index funds.
This is just a passive portfolio with no fiddling, no active funds, and no chasing hot fads. Just a boring mix of rather boring, low-cost, passive index ETFs/funds. (The returns discussed below are before fees, so the after-fee returns from passive funds/ETFs would be an average of around 0.2% lower).
In 2022-23 (middle chart), this standard passive diversified portfolio returned a very healthy 12% for the year, despite the doom and gloom of war in Europe, inflation, rate hikes, Chinese slowdown, recession in Europe, etc. If your long-term portfolio did not achieve these returns, ask your fund or portfolio manager for a detailed explanation of why.
The good returns in 2022-3 more than made up for the -8% negative return on the same portfolio for the prior financial year (left chart). The portfolio returned +21% in the 2020-21 financial year but was dead flat in 2019-20.
CPI+4% pa return target achieved over 7 years
These are long term portfolios, so we need to look beyond just annual returns. As this is a ‘growth’ portfolio with 70% in shares, we need to take at least a seven-year view. Average annual returns over the past seven years to June 2023 shows a sea of green across all asset classes, with modest positive returns across the board, although it is notable that all asset classes returned a little below their long-term historical averages.
Even with below average returns, our boring passive diversified 70/30 portfolio would have returned a respectable average annual return of 7.5% per year (less a fraction for passive index fund fees). This was more than 4% above the average inflation rate over the period (3.2% pa).
Why do we focus on a ‘CPI+4%’ total return goal? If a portfolio is able to generate long term average total returns after fees of CPI+4% pa, and holds enough cash to handle sequencing risk so we can avoid selling assets to fund withdrawals when prices are low, then it can allow a withdrawal rate of 4% of capital (4% is where the minimum withdrawal rate from super pension accounts start), and allow both the cash withdrawals, and the remaining capital after withdrawals, to keep growing to keep pace with inflation (ie. withdrawals and capital value maintain their real values) over time.
Over the past seven years, our boring diversified portfolio of passive index funds exceeded the critical CPI+4% target returns, despite the global pandemic lockdowns, the sharpest and deepest economic recessions in every country since the 1930s Great Depression, the turbulent Trump years, trade wars, war in Europe, ‘Brexit’, political turmoil and fragmentation across the world, the worst inflation spikes in 40 years, various banking crises, numerous corporate bankruptcies, and a host of other things to scare off investors.
Seven years ago, nobody could have predicted that events would turn out to be as bad as they did, but simple, diversified portfolios did just fine through it all!
That is the past, of course, but we are interested in the future. Although the future is unknowable, we can assume that future events will probably be just as interesting and challenging as the past, but we can also suggest that a simple diversified portfolio of low-cost funds will continue to have a good chance of generating the required returns we need in the long term.
Ashley Owen, CFA is Founder and Principal of Owen Analytics. Ashley is a well-known Australian market commentator with over 40 years’ experience. This article is for general information purposes only and does not consider the circumstances of any individual.