Register For Our Mailing List

Register to receive our free weekly newsletter including editorials.

Home / 538

Blending active and passive into a winning portfolio

When you look at the long-term equity index charts moving up and to the right, it’s easy to forget the individual stocks underpinning the indices don’t move up and around as a unified block.

This has important implications for how you try to extract returns from the equity markets and the approach you take to building a quality portfolio.

Beating the performance of the broader share market in any one year isn’t an easy task and, when you look at the data and the facts, the truth is it’s way harder than most people think.

And, as you would expect, it’s even more difficult to beat the market’s performance over multiple years, let’s say over five, 10 and 15 years.

In essence, that’s the Herculean task faced by all active investment managers – whether they be professionals running large portfolios or individual investors with a small portfolio of hand-picked stocks. That is, if you’re investing actively, your whole modus operandi is to beat the broad market averages like the S&P/ASX 300.

Global index provider Standard & Poor’s measures the performance of active fund managers over time. The 2022 S&P Index Versus Active scorecard, widely known in investment circles as SPIVA, showed 57% of actively managed large-cap Australian equity funds (funds that invest in a selection of the largest Australian companies chosen by an investment team) underperformed the S&P/ASX 300 Index last year.

The SPIVA report also shows that active underperformance rates over the longer term were even more dismal.

Over five, 10 and 15-year time horizons actively managed large-cap Australian equity funds underperformed the S&P/ASX 300 Index by 81%, 72% and 83.5%, respectively.

The takeaway here is, when investors go active, they are more likely to be in the long-term majority of the distribution that underperforms rather than the smaller percentage that outperforms. This isn’t just an Aussie thing. We see similar results in equity markets all around the world.
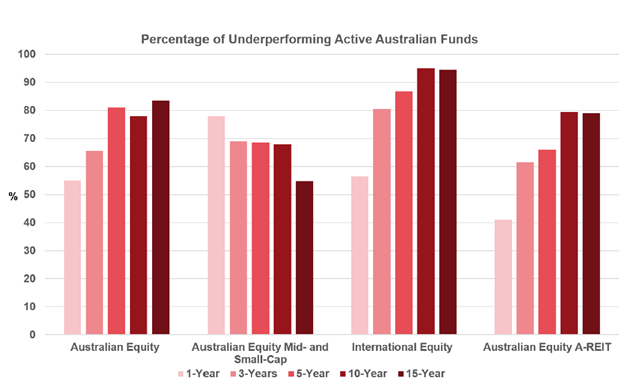
Source: Standard & Poor’s

Costs are a headwind to active

All investors are subject to the costs of participating in the market.

These costs include management fees, bid-ask spreads, administrative costs, commissions, market impact and, where applicable, taxes. These costs can be high and reduce investor returns over time.

And costs create a hurdle that must be overcome to beat the market averages.

Because the average costs of active management are typically much higher than those of index funds, this is a strong headwind that diminishes the chances of successful active outperformance.

The equity market is 'skewed'

Before I got into index investing, I assumed that half of all stocks outperformed a market index and the other half underperformed in a given year.

Successful active stock picking meant selecting from the top half, avoiding the bottom half, and making massive amounts of money, or “alpha” as the pros call it.

Unfortunately, that’s not the way equity markets really work. In reality, there are huge tails when you look at the extreme over- and under-performers in the market. This asymmetry is what we call the 'skewness' of equity returns.

As shown in the chart below, a positively skewed distribution has a tail which is more pronounced on the right side (positive) than it is on the left (negative).

In a positively skewed distribution, there are a few really large data points way out in the tail that pull the average up. That is, the mean (average) is greater than the median (middle), with the most extreme values on the right side.
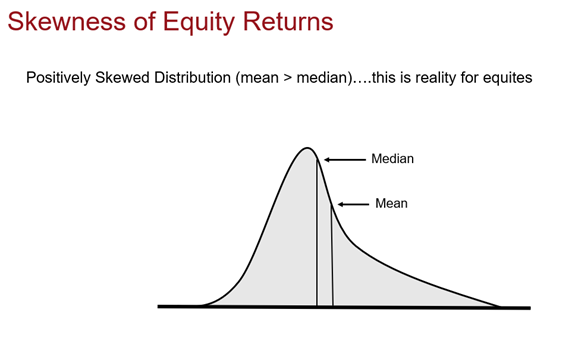
Source: Vanguard


When thinking more deeply about equities, we might intuitively suspect there is a natural tendency towards a right skew—after all, a stock can only go down by 100%, while it can appreciate by way more than that. A handful of stocks go up by 200%, 300%, 500% or 1,000%, and that’s where the bulk of equity index returns really come from.

What this means for investors with a well-diversified portfolio is they typically experience frequent small losses from the majority of stocks, but a few exceptionally large gains from a subset of their holdings.

In 2022, roughly a third (33%) of the top 300 companies outperformed the return from the S&P/ASX 300 Index. So, to outperform the market, an active investor needed to be concentrated in that 33% of outperforming companies.

The 10-year period from the start of 2012 to the end of 2022 shows only 17% of the companies in the S&P/ASX 300 Index beat the performance of the broader market average over that time. Furthermore, the top three ASX stocks (Commonwealth Bank, CSL and BHP) accounted for 24% of the total index return.

This skewness becomes even more pronounced over the 20 years from the start of 2002 to the end of 2022. Only 6% of the companies in the S&P/ASX 300 Index beat the performance of the broader market over this time, with the top three stocks (BHP, Commonwealth Bank and Westpac) accounting for almost one-third of the total index return.

Put another way, if an active investor didn’t have those three particular stocks in their portfolio they would have missed out on a fair chunk of the market’s return.
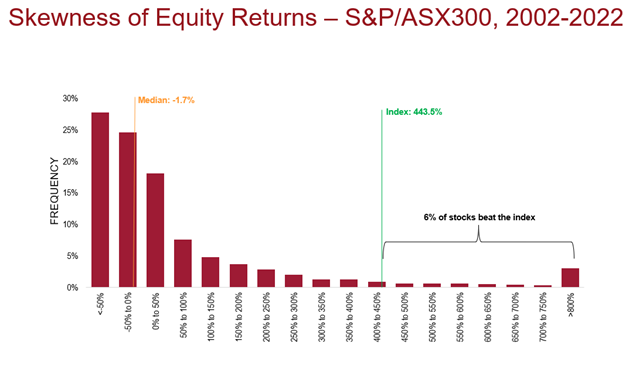
 

Source: Standard & Poor’s


Striking a balance: Index + Active

So, how can investors position their portfolio to take advantage of this skewness of equity returns?

If there is one takeaway, it’s that index managed funds and exchange traded funds should be a consequential piece of a core equity portfolio.

Think of broad-based index funds as a way to 'tame the skewness' of equity markets because they capture the upside of those extreme winners and tilt the odds in an investor’s favour. It’s simply the most efficient way to capture long-term equity market returns.

Now you know why the search for winning active fund managers is a tough and ultimately unrewarding one for most investors. So, consider dialling back your active exposure and dialling up your index exposure.

The core/satellite approach to building a portfolio is a great framework for blending both index and active. Start with a broadly diversified index core holding. Then add some small low-cost active satellite holdings around the margins where you have conviction, unique needs, or access to a truly talented active manager to round it out.


Duncan Burns is Chief Investment Officer for Asia-Pacific at Vanguard Australia, a sponsor of Firstlinks. This article is for general information purposes only and does not consider the circumstances of any individual.

For more articles and papers from Vanguard Investments Australia, please click here.


5 Comments
Duncan
December 23, 2023

Hi Jake- there are a number of great active managers in the market adding value after costs & you’ve listed a few, so I agree with you there. But the point is, there are fewer winning active managers than most people think. The reality is, the hunt for winning active managers over is a tough and ultimately unrewarding one for most investors over the long term.

So the key takeaway I hope you and other readers walk away with is not “active vs passive” but rather passive should be a consequential piece of most core portfolios.

The core-satelite approach utilising a quality low cost diversified index core with a sprinkle of active hot sauce in the satellite is a winning strategy….if you have conviction and a process/approach to picking a few winning active managers.

Mark Hayden
December 12, 2023

That skewness chart for 2002-2022 certainly catches my attention. I would be interested in that chart over other time periods - changing both the start date and end date. I want to invest with a long-term focus, but that doesn't mean buy-and-always-hold and I note the Top 10 weighted stocks, especially in the US, varies over the decades. Thanks, as a long-term investor this has been a good thought-provoking article.

Charles
December 10, 2023

There is another way that Australian investors have demonstrated ability to beat the market over long period of time and that is protecting the downside. This reduces volatility drag. You do not have to keep up with the bull market if your returns are half the draw down (which have tended to be very big) as you compound out from a higher base you build more wealth over time than simply investing in the market.

Duncan
December 23, 2023

Hi Charles- thanks for the comment….it’s one I get often when presenting on the case for indexing.

There is strong evidence that active underperforms passive most of the time but not all the time. So it’s reasonable to think that active could outperform in certain circumstances like bear markets.

Our research shows that the average active manager typically holds more cash relative to passive managers and this (+ cost) is a key driver of return differences. Cash hurts active performance during bull markets in the form of cash drag. And even though that cash should boost relative active performance in bear markets, what the numbers show is that while fewer active managers underperform in bear markets, most still do. So the key takeaway here is, the average active manager underperforms by less in bear markets.

Volatility drag is a good call out, but on average, passive looks favourable using both arithmetic and geometric returns.

Jake
December 07, 2023

Reckon the tilt to passive has gone too far. There are very good managers in Australia, especially in small caps. Ophir, Ausbil, Eley Griffiths, Auscap, Mirrabooka, all have great long-term track records.


Leave a Comment:

RELATED ARTICLES

Track if your fund manager is taking the best shot

Index versus active? Nobel Prize professors can’t agree

banner

Most viewed in recent weeks

Vale Graham Hand

It’s with heavy hearts that we announce Firstlinks’ co-founder and former Managing Editor, Graham Hand, has died aged 66. Graham was a legendary figure in the finance industry and here are three tributes to him.

Australian stocks will crush housing over the next decade, one year on

Last year, I wrote an article suggesting returns from ASX stocks would trample those from housing over the next decade. One year later, this is an update on how that forecast is going and what's changed since.

Avoiding wealth transfer pitfalls

Australia is in the early throes of an intergenerational wealth transfer worth an estimated $3.5 trillion. Here's a case study highlighting some of the challenges with transferring wealth between generations.

Taxpayers betrayed by Future Fund debacle

The Future Fund's original purpose was to meet the unfunded liabilities of Commonwealth defined benefit schemes. These liabilities have ballooned to an estimated $290 billion and taxpayers continue to be treated like fools.

Australia’s shameful super gap

ASFA provides a key guide for how much you will need to live on in retirement. Unfortunately it has many deficiencies, and the averages don't tell the full story of the growing gender superannuation gap.

Looking beyond banks for dividend income

The Big Four banks have had an extraordinary run and it’s left income investors with a conundrum: to stick with them even though they now offer relatively low dividend yields and limited growth prospects or to look elsewhere.

Latest Updates

Investment strategies

9 lessons from 2024

Key lessons include expensive stocks can always get more expensive, Bitcoin is our tulip mania, follow the smart money, the young are coming with pitchforks on housing, and the importance of staying invested.

Investment strategies

Time to announce the X-factor for 2024

What is the X-factor - the largely unexpected influence that wasn’t thought about when the year began but came from left field to have powerful effects on investment returns - for 2024? It's time to select the winner.

Shares

Australian shares struggle as 2020s reach halfway point

It’s halfway through the 2020s decade and time to get a scorecheck on the Australian stock market. The picture isn't pretty as Aussie shares are having a below-average decade so far, though history shows that all is not lost.

Shares

Is FOMO overruling investment basics?

Four years ago, we introduced our 'bubbles' chart to show how the market had become concentrated in one type of stock and one view of the future. This looks at what, if anything, has changed, and what it means for investors.

Shares

Is Medibank Private a bargain?

Regulatory tensions have weighed on Medibank's share price though it's unlikely that the government will step in and prop up private hospitals. This creates an opportunity to invest in Australia’s largest health insurer.

Shares

Negative correlations, positive allocations

A nascent theme today is that the inverse correlation between bonds and stocks has returned as inflation and economic growth moderate. This broadens the potential for risk-adjusted returns in multi-asset portfolios.

Retirement

The secret to a good retirement

An Australian anthropologist studying Japanese seniors has come to a counter-intuitive conclusion to what makes for a great retirement: she suggests the seeds may be found in how we approach our working years.

Sponsors

Alliances

© 2024 Morningstar, Inc. All rights reserved.

Disclaimer
The data, research and opinions provided here are for information purposes; are not an offer to buy or sell a security; and are not warranted to be correct, complete or accurate. Morningstar, its affiliates, and third-party content providers are not responsible for any investment decisions, damages or losses resulting from, or related to, the data and analyses or their use. To the extent any content is general advice, it has been prepared for clients of Morningstar Australasia Pty Ltd (ABN: 95 090 665 544, AFSL: 240892), without reference to your financial objectives, situation or needs. For more information refer to our Financial Services Guide. You should consider the advice in light of these matters and if applicable, the relevant Product Disclosure Statement before making any decision to invest. Past performance does not necessarily indicate a financial product’s future performance. To obtain advice tailored to your situation, contact a professional financial adviser. Articles are current as at date of publication.
This website contains information and opinions provided by third parties. Inclusion of this information does not necessarily represent Morningstar’s positions, strategies or opinions and should not be considered an endorsement by Morningstar.