The BRICs concept (investing in Brazil, Russia, India and China) captured investors’ imagination like few others. But, above and beyond its acronymic catchiness, did it given us a deeper understanding of the risks and rewards that come with investing in emerging markets, thereby allowing us to profit from this asset class?
I have long had my doubts. These have been confirmed by a close examination of how emerging markets have performed since 2000, rising and falling with the ebb and flow of the commodity tide and, post 2008, the veritable tsunami of central bank-created liquidity that has washed over financial markets.
Time to regroup emerging markets
It’s time to move away from the prism – one might say prison – of the BRICs approach (in its original form, so excluding South Africa) and instead frame the emerging market investing opportunity in terms of country blocs that perform broadly in line with each other as the macro environment evolves. I have identified four main blocs, derived from a 2x2 matrix that:
- distinguishes between whether a country tends to run a structural current account deficit or surplus, and
- whether it is primarily a commodity or manufactured goods exporter.
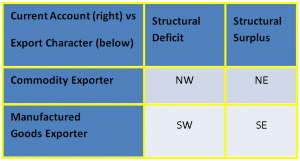
For emerging markets, countries can be assigned as follows:
- the oil exporters are generally found in the North East (NE) bloc
- South Africa and the rest of sub-Saharan Africa, South America and Indonesia are in the North West (NW) bloc
- the maquiladoras (Mexico; most of Eastern Europe and Turkey) plus the Indian sub-continent are in the South West (SW) bloc
- China-centred East Asia is in the South East (SE) bloc. Recession-hit Czech Republic and Hungary are also recent arrivals to the SE bloc.
It is important to note that this matrix is not unique to emerging markets: the developed world can also be handily described by it. Oil-exporting Norway is in the NE; Australia, Canada and New Zealand are in the NW; the US and the UK are in the SW; and Japan, the Eurozone (which includes emerging markets Greece, Slovakia and Slovenia), Switzerland and Scandinavia are in the SE.
The main distinction lies between the eastern (NE and SE) and western (NW and SW) two blocs. The latter will experience currency depreciation unless they can attract capital inflows to balance their external account; the former are essentially self-financing and are prone to currency appreciation unless their central banks suppress it and instead add to foreign exchange reserves, sometimes via funding sovereign wealth funds. The financial health of the two western blocs is closely correlated to the state of global liquidity.
Northern bloc depends on commodity cycle
A secondary distinction exists between the northern (NW and NE) and southern (SW and SE) two blocs. Over the long term, the former will likely experience relative terms of trade loss versus the latter as commodities see their pricing power versus manufactured goods erode. From the late 1990s, the advent of the commodity supercycle reversed this trend, though since 2011 the normal relationship appears to have resumed, more for metals and coal than for oil and gas. This has weighed on the NW bloc’s prospects more than that of the NE. The financial health of the northern blocs is correlated to the state of commodity markets.
These two distinctions are driven by two dominant players: the United States largely determines the status of global liquidity whilst China determines the health of global commodity markets. (Note that in 2013, China even overtook the US to become the world’s largest oil importer.)
Metaphorically, this means that – to adapt a phrase from the Bard – there are not one but two tides in the affairs of emerging markets: the liquidity tide which is governed by the American moon and the commodity tide which is ruled by the Chinese moon. Over the past decade, these two moons have not waxed and waned in synchrony, so neither has the ebb and flow of these two tides been coordinated.
The prospects of each bloc depends upon interaction between the two tides: for instance, 2011 saw the high tide for commodities coincide with strong liquidity flows arising from the Federal Reserve’s quantitative easing programme being in full flood. This synchronicity was ideal for the NW bloc and both the Brazilian Real and the Australian Dollar reached their peak values during 2011.
Bloc helps to identify risk better than BRIC
Over time, one can observe that risk in emerging markets, mainly represented by volatility, is lowest in the SE bloc and highest in the NW. And, for most of the past decade, the relative positive derived from the current account surplus nature of the NE bloc has outweighed the relative negative arising from its commodity-exporting nature. Net result? The NE bloc has been less risky than the manufactured goods-exporting but deficit-running SW bloc. But in 2014, geopolitics intervened as the fallout from Ukraine weighed on the financial prospects of NE bloc’s largest member, Russia.
Determining where a nation, emerging or developed, fits into this 2 x 2 bloc matrix is far from discovering the Holy Grail of global investing. As evidenced by the Ukraine crisis, specific events can and do impact individual countries, both positively but more often negatively. But for investors, I believe the bloc approach is far more useful than the BRIC approach which, in essence, is but an exercise in sizeism. The irony is that, and this is purely a coincidence, there just happens to be one BRIC in each of the four emerging market blocs.
Dr Michael Power is a Strategist with Investec Asset Management. He has 25 years of professional experience working in Africa, the Middle East and the United Kingdom.