When used prudently, financial leverage can enhance investment returns when investing in non-residential real estate. However, when leverage is deployed excessively or structured inappropriately, the investment results can be catastrophic.
Many articles have been written on excessive leverage in the system leading up to the GFC and the resultant fall-out for both borrowers and lenders when the music stopped and real estate asset prices tumbled. However, it is important some six years later, that as Australia’s interest rates head lower and competition amongst lenders intensifies, we don’t forget the impact that aggressive leverage levels and poor capital management strategies can have on investment returns.
Sensitivity to gearing levels (leverage)
Before discussing where we are today, it is worth highlighting how sensitive investment returns are to rising and falling real estate prices at various leverage (gearing) levels.
The following table shows the impact of leverage using 30%, 50% and 65% gearing on a real estate asset that has been acquired for $1 million (click to enlarge).
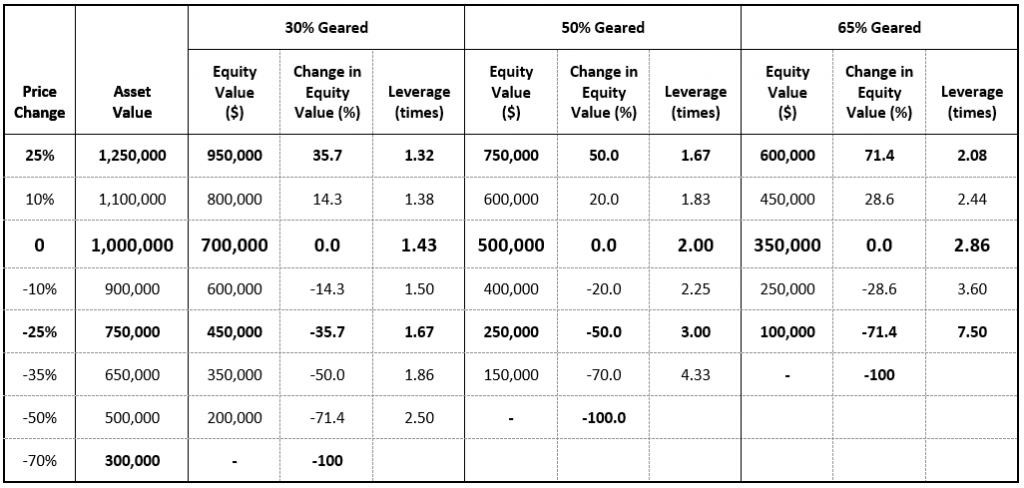
As an example of how to calculate the leverage, a $1 million property with 30% borrowed and 70% capital is leveraged at $1,000,000/$700,000 or 1.43. Transaction costs excluded for simplicity.
A 25% rise in the value of the asset shows that an investor’s equity return with 30% leverage increases by 35.7%, 50% at 50% leverage and 71.4% for an investor leveraged at 65%.
The bottom rows in the table show the symmetry in equity values from a fall in the value of the asset. A 25% decline in value, (not unrealistic – according to the Property Council/IPD All Property Index, capital values fell by 36% in the 1991/1992 downturn and by 15% post the GFC) results in the leverage level increasing to 1.67 times at 30% leverage, 3.0 times at 50% and 7.5 times at 65% while the value of an investor’s equity declines by 35.7%, 50% and 71.4% respectively.
For an investor to lose all of their equity using 30% leverage, the asset’s value would need to decline by 70%. An investor using 65% leverage will see all of their equity wiped out if the asset value declined by 35%.
This simple example highlights two important principles of leverage:
- leverage magnifies the creation or loss of value; and
- the volatility of an investor’s equity rises as leverage increases.
What level of leverage should be used in real estate?
There is no single leverage ratio that is universally appropriate. Firstly it depends on the risk tolerance of each investor. Once the decision to use leverage is made, an investor needs to consider a range of factors at the asset level and in structuring their debt.
Asset level factors include:
- the point in the cycle that the leverage is being used - what is the likelihood of the asset’s price increasing or decreasing in the coming years
- location – how deep is the market if you want to exit, what are the supply and demand fundamentals of that location?
- quality of the tenant covenants – what is the likelihood of tenant default?
- lease expiry profile – are there any vacancies or upcoming lease expiries?
- quality of an asset’s income streams – can the cashflow from the asset adequately cover the debt costs? What are the lease structures and rent review mechanisms in the leases?
- investment hold period – is the asset being held for short-term trading or long-term investment?
In structuring and managing the debt, factors to consider include:
- cost of debt - the higher the leverage, typically the higher the cost of the debt that the lender requires to compensate for the increased leverage risk
- debt covenants – the maximum loan to value ratio and minimum interest cover ratios that the lender will require
- type of debt – interest only or principal and interest?
- source of debt – traditional bank lending or capital markets medium term notes, CMBS etc?
- capital stack – is the debt just senior “first ranking” or has the capital stack been layered to allow a combination of senior and mezzanine debt)
- duration of the debt - short or long-term?
- hedging profile - how much of the debt is at fixed or variable interest rates?
Where are we today?
Real estate asset prices are rising. According to the PCA/IPD Property Index, industrial assets generated a capital return of 4.4% in the year to December 2014 followed by retail at 3.8% and office at 2.8% (and total returns including income were 13%, 10.7% and 10% respectively). We expect a similar story to unfold this year. Investors are continuing to chase real estate assets and bid up prices driven by the high yields relative to cash (in the case of domestic investors) and the high yield relative to other global real estate markets and falling Australian dollar (in the case of international investors).
At the same time, competition amongst lenders to deploy capital is increasing and lending margins are contracting. By way of example, in December 2012 Folkestone secured a margin of 2.15% plus the Bank Bill Rate on a new building with a 10-year lease to a major global tenant. Fast forward just over 2 years, and the margin would now be circa 1.30% – a 0.85% decline. Over the same period, the Bank Bill Rate has fallen from 3.1% to 2.35% – a decline of 0.75%. The result, the all-in-cost of debt, has fallen from 5.26% to 3.65%.
In such an environment, the risk is investors (obviously with the support of their lenders) start to push leverage levels higher. Firstly, because the cost of debt is cheaper and secondly, in an environment where yield is king and asset yields are falling as prices rise, higher leverage reduces the amount of equity required and therefore increases the potential return on equity.
The gearing level of the A-REIT sector is currently around 31%, up from 28% a few years ago but well below the high 30%’s recorded in the lead up to the GFC. Whilst leverage levels have ticked up, most A-REIT’s appear to have learnt their lesson and have stated they will not gear up to pre-GFC levels. A-REITs have also put in place more prudent capital management strategies around interest rate hedging and diversifying their source and duration of debt.
Likewise, most managers who offer unlisted real estate funds and syndicates are also acting more prudently. Gearing in these funds now ranges between 40% and 50% with reasonable headroom given a typical 60% to 65% loan to value ratio covenant. However, in recent months, a few managers have started to take leverage levels back towards 65%, leaving little or no headroom. Leveraging up in a market when asset prices are rising and debt costs are low, as the table above shows, can generate supersized returns. However, the risk in those funds is significantly heightened when the cost of debt goes up and/or the real estate cycle turns and prices fall as it inevitably will at some point down the track.
Given the power of leverage to magnify investment returns, both positive and negative (whether investing in listed A-REITs, unlisted funds or buying real estate directly), investors need to understand that prudent use of leverage, with appropriate capital management strategies can be an effective financial instrument. However, as Warren Buffet said “… when you combine leverage and ignorance, you get some pretty interesting results”.
Adrian Harrington is Head of Funds Management, Folkestone Limited (ASX code FLK). This article is general information and does not consider the personal circumstances of any investor.