Conventional economic theory assumes individuals are perfectly rational in their decision making under uncertainty. This is usually known as expected utility theory.
Prospect theory, on the other hand, represents more how people actually behave rather than how they are expected to behave. Its two main components are overweighting of tail probabilities and the shape of utility function.
Prospect theory considers options relative to a reference point – see below – rather than in terms of absolute wealth. This is contrary to the long-accepted theory that losses and gains are felt equally. While controversial, it has been shown to appear in many human pursuits.
Here are some examples:
Insurance: Prospect theory implies that we tend to overweight low probability events, like a house fire or some other catastrophe. We are willing to pay insurance premiums for these highly unlikely events, effectively switching a low probability large loss for a certain smaller loss. At the same time, we are less likely to purchase insurance for higher probability lower loss events, like loss or damage to a mobile phone.[1]
Gambling: Why are gamblers willing to bet on zero or negative expected value games in casinos?[2] Think of the example of a gambler who loses $500 compared to a gambler who has won $200. The losing gambler is more likely to take on another $500 gamble (“to make up the loss”) than the winning gambler. Losses matter more than gains.
Health: Prospect theory seems to apply to non-monetary rewards as well as monetary. It seems obvious but individuals who are less satisfied with their body shape and wish to lose weight tend to have higher risk seeking behaviour when it comes to weight loss or gain. That is, they equate weight loss (gain) with “psychological” gain (loss), and their aversion to weight gain is roughly twice their desire for weight loss (in the sample from the paper).[3]
In investments, a similar behaviour has been observed, which has been named the disposition effect.
Disposition theory was first identified and named by Shefrin and Statman (1985) [4],[5], where it was found while looking at trading patterns of individual retail investors. The name comes from the idea that:
Investors are “predisposed” to sell winners too early and to sell losers too late, and they find evidence that this exists – and it is not a tax effect.
An example: you own stock A which has risen in value. You believe that there is still upside in the stock but timing the top is difficult, and “you never go broke taking a profit”. That is, you are aware that the price might go higher, but you are comfortable missing out and would repeat the action.
Or you own stock B which has fallen in value. You think the stock could fall further, and it could also rise again, but you decide to “hang on for the ride”. You don’t sell out because you have already absorbed the loss, and you are ok if it goes lower and would repeat the action.
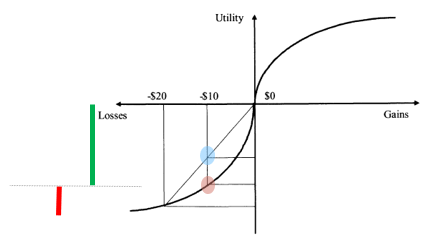
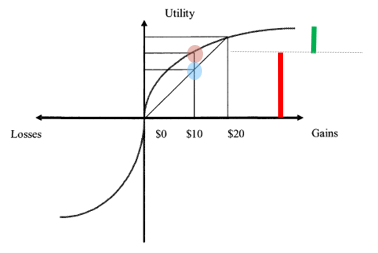
The figures below come from Frazzini (2006)[6] with some additions to clarify the ideas.
Case 1: Stock falls $10 and we don’t sell
In the first chart below (Figure 1), we own a stock with the Reference Point at the centre or origin. The stock then falls $10 and we want to assess whether we would sell now. For simplicity, assume the next move is equally likely to be +$10 or -$10.
If risk neutral – blue dot – so we are indifferent to buying or selling.
However, if we use the Prospect Theory utility function - red dot - then the story is different.
If the stock recovers and we have not sold, the positive change in utility from continuing to hold the stock is the green bar. That is, there is significant upside to our utility if we don’t sell and the price recovers. If the stock continues to fall and we have not sold, we lose another $10 but the reduction in utility (the red bar) is smaller than the green bar.
In other words, the $10 upside means more to us than the $10 downside. If the stock is equally likely to go up or down by $10, and we do not sell, then the expected change in utility (green bar less red bar) is positive. So we don’t sell.
Figure 1: The Disposition Effect with a loss – do not sell.

Case 2: Stock rises $10 and we sell
In the second chart below (Figure 2), we own a stock with the Reference Point again at the origin. The stock then rises $10 and we want to assess whether we would sell now. For simplicity, again assume the next move is equally likely to be +$10 or -$10.
If risk neutral – blue dot – so we are indifferent to buying or selling.
However, if we use the Prospect Theory utility function - red dot - then the story is different.
If the stock falls and we have not sold, the negative change in utility from continuing to hold the stock is the red bar. That is, there is significant downside to our utility if we don’t sell and the price falls. If the stock continues to rise and we have not sold, we gain another $10 but the increase in utility (the green bar) is smaller than the red bar.
In other words, the $10 upside means less to us than the $10 downside. If the stock is equally likely to go up or down by $10, and we do not sell, then the expected change in utility (green bar less red bar) is negative. So we sell.
Figure 2: The Disposition Effect with a gain – sell

To summarise, even if the probability of the next price change is equally likely to be up and down, we will choose to sell if the price has already risen but not sell if it has fallen.
Can we trade on this? Operationalising Prospect Theory
Behavioural biases push prices away from fundamentals – e.g., selling early or late in the case of the disposition effect.
Here, if prices have fallen below the individual’s reference price, the individual is less likely to sell, creating an imbalance of buying over selling so future returns will be higher. On the other hand, if prices have risen above the reference price, selling has an increased likelihood, so the resulting imbalance selling over buying means future returns will be lower.
This idea might be captured by a strategy which buys stocks which have fallen and sells stocks which have risen. In other words, it may look like a price reversal/value or anti-momentum strategy. While academic research suggests that such a strategy may be additive, this remains to be seen in practice.
[1] https://thedecisionlab.com/biases/loss-aversion
[2] Barberis (2011) NBER working paper, “A Model of Casino Gambling”
[3] For example, Lim and Bruce (2015), Frontiers in Psychology: “Prospect theory and body mass: characterising psychological parameters for weight related risk attitudes and weight-gain aversion”
[4] Shefrin and Statman (1985), Journal of Finance, “The Disposition to Sell Winners Too Early and Ride Losers Too Long: Theory and Evidence”
[5] There are many other examples in the literature which demonstrate the disposition effect. An early sample:
Heisler (1994), Review of Futures Markets, “Loss aversion in a futures market: An empirical test”
Weber and Camerer (1998), Journal of Economic Behaviour and Organisation, “The disposition effect in securities trading: An experimental analysis”
Odean (1998), Journal of Finance, “Are investors reluctant to realize their losses?”
Odean (1999), American Economic Review, “Do investors trade too much?”
Heath, Huddart and Lang (1999), Quarterly Journal of Economics, “Psychological Factors and Stock Option Exercise”
[6] Frazzini (2006), Journal of Finance, “The Disposition Effect and Underreaction to News”
Dr. David Walsh is Head of Investment at RQI Investors, a wholly owned investment management subsidiary of First Sentier Investors, a sponsor of Firstlinks. This article is general information and does not consider the circumstances of any investor. You can read the full version of David’s research paper on Prospect Theory and the Disposition Effect here.
For more articles and papers from First Sentier Investors, please click here.