Many Australian investors have an overly-large allocation or home bias towards Australian shares in their investment portfolios relative to global shares, despite the purported benefits of diversifying more globally.
Australia accounts for less than 3% of the MSCI World index, yet the average large superannuation fund holds 22% in listed Australian shares versus 23% in global listed shares (as a percentage of total assets under management). Expressed another way, half their listed equity exposure is domestic.
Reasons SMSFs allocate to Australian shares
There is no definitive data on SMSFs, but the average SMSF allocation is between 30% and 40% to Australian shares (including via funds) and only about 10% to global shares. ATO data on SMSFs is unreliable because it only shows direct holdings of global shares, not the majority of the allocation via managed funds and ETFs.
Part of this large home bias to Australian shares may be explained by domestic investors having liabilities in Australian dollars (AUD), and they are happy to receive AUD returns to fund AUD expenses. Other reasons include potentially higher costs associated with direct global investments as well as the tendency for investors to invest in companies they are familiar with.
In Australia, we have another reason to invest in domestic stocks: franking credits.
Australian companies that pay Australian company tax can distribute franking tax credits to Australian investors, and these can typically boost returns by approximately 1.5% p.a. for the S&P/ASX200.
With franking credits potentially under threat for SMSFs and low tax individuals under the current Labor proposal, it is timely to reassess the impact of franking credits on home bias to understand the impact of changes to taxation policy.
Optimal asset allocation with and without franking
First, even without franking credits, the Australian equity market has provided highly competitive long-term returns. Credit Suisse’s Global Investment Returns Yearbook 2019 shows that the Australian market beat all other developed markets over the past 119 years (1900-2018). Real returns (returns in excess of inflation) in US dollar terms over that period show Australia just pipped the US equity market to take the top spot, realising a real return in USD of approximately 6.5% p.a. In real local currency (AUD) terms, the Australian market rose slightly more at around 6.7% p.a. over the same period. These returns are before franking credits.
In order to estimate the impact of franking credits, we built an efficient portfolio (where efficiency is based on building the highest returning portfolio for a given level of portfolio risk) based on return expectations which both include and exclude the benefits of franking credits. Unlike most analyses, we build our portfolios bottom-up based on individual stock return expectations, rather than top down using country allocations.
Our portfolios are benchmark-unaware with currencies unhedged. Stock level return forecasts are based on Plato’s global alpha model, with franking credits added for with-franking portfolios. We built a range of optimal portfolios for a given level of total portfolio risk.
The impact of franking
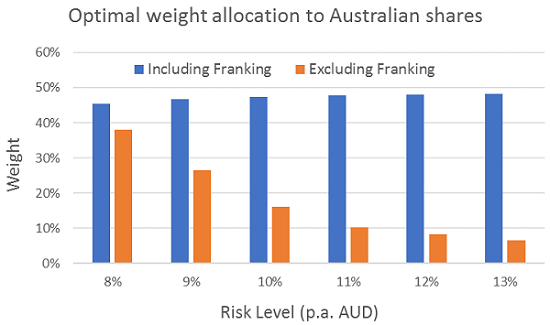
Not surprisingly, Figure 1 shows that when we include franking credits, the optimal allocation to Australian shares goes up.
Figure 1. Optimal allocations to Australian shares within the equity allocation

For reasonable ranges of risk, the optimal allocation to Australian shares (within the equity allocation component, not the entire portfolio) including franking is just under 50% which is consistent with the allocations of large superannuation funds. That is, a similar allocation to domestic and global equities.
If we exclude franking credits, efficient allocations to Australian shares fall significantly to just below 40% and as low as less than 10%, depending on the investor’s risk tolerance. That is, at high levels of risk tolerance, the optimal allocation to global equities rises significantly without franking.
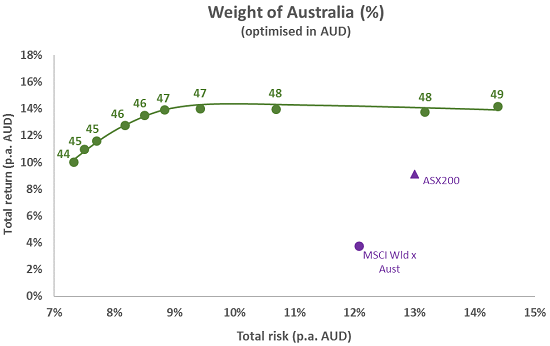
Figure 2 plots the efficient frontier for franking credit-inclusive returns, and also highlights the percentage exposure allocated to Australian shares at different risk levels.
Figure 2. The efficient frontier for returns when including franking credits

It also highlights that a portfolio built from individual stocks is significantly more efficient than either an S&P/ASX200 portfolio or an MSCI World ex Australia portfolio.
That is, we have built a portfolio with substantially higher returns and significantly less risk than an index investment in either the Australian or global equity markets.
Digging into the results, the weighting in banks tends to be underweight the MSCI index when franking is excluded.
However, when franking is included, there is an increase in banking weight of 5-7% for much of the efficient frontier, and this reflects a steering of the portfolio away from global banks and into Australian banks. This is an interesting empirical result and is also an outcome we observe in many retail portfolios.
In summary, our analysis finds that franking credits help explain Australians’ home bias, justifying the average asset allocations of large super funds.
SMSFs still have a problem
Our analysis does not justify the much higher weighting that SMSFs have in Australian shares. Remember, we are looking at allocation within the equity component, not over all asset classes. SMSFs typically have 75% or more allocated to Australian equities within the equity component.
Our analysis would also suggest that for investors who may lose franking credit refund ability under the Labor proposal, allocations to Australian shares could fall significantly, by as much as 40% of total equity allocations depending on risk appetite, in favour of global shares.
However, we don’t expect individual investors will all significantly reduce their allocations to Australian shares. While losing franking might encourage many investors to reduce their Australian share exposure, home bias and capital gains tax for taxed investors will likely reduce the amount of money switched from Australian shares.
When we surveyed our clients, 81% of 1,414 respondents said they would reduce exposure but 7% said they would not, with the balance not knowing.
In terms of where investors would re-allocate their funds, for those who did say they would reduce exposure, almost half (46%) said they would increase exposure to global shares. Only 8% of respondents indicated they would increase their exposure to property.
Jonathan Whiteoak is Senior Quantitative Analyst and Dr Don Hamson is Managing Director at Plato Investment Management. This article is general information and does not consider the circumstances of any investor.