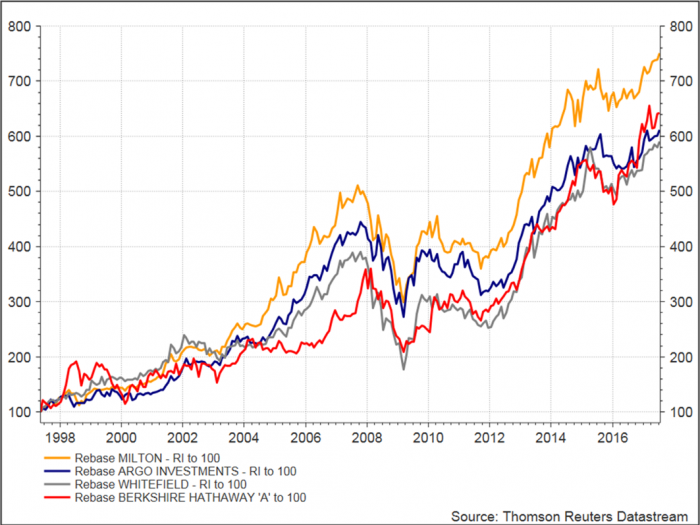
[Editor’s Note: Peter Thornhill is a respected author and financial markets commentator, and a lecturer at the Centre for Continuing Education at Sydney University. He has been part of a lively conversation on dividends in our comments section, and sent in the following additional comment on the performance of three Australian LICs vs Berkshire Hathaway].
While at a minimum all three Listed Investment Company’s (LIC’s) performed on total returns at similar or better levels than Berkshire over the time frame, the chart below understates the LIC returns, which have also had a second layer of tax taken out. It is not a true like for like comparison, even when comparing amongst LICs who have realised gains and paid tax at different times and levels, so care should be taken when using this. Compound charts of this nature may also be impacted by the start date.
The LIC returns include the underlying investments held by the LICs having paid tax at 30% (which is the same as Berkshire paying its own company level tax) BUT also include the LICs paying investor level tax at 30% on realised capital gains. They would ultimately pass on the imputation credit for the tax paid to the investor. If you added this back to the LICs their returns would be higher again.
From the data on hand it is not possible however to distinguish between adding back the imputation credits on the realised capital gains from the imputation credits attached to the dividends on the underlying investments. However, the imputation credits in total are worth 1.5% - 2% per year and over 20 years would add a significant amount to the compounded end values of each LIC.
For an Australian investor who receives the benefit of the full level of franking credits, the compound end value of the returns of the LICs would be more than 50% higher than that shown below (i.e. the end value from MLT/WHF/ARG including the franking credits would exceed 900 in all cases).

LICs versus Berkshire shares; effects of imputation