Register For Our Mailing List

Register to receive our free weekly newsletter including editorials.

Home / 153

Pension drawdown affects asset allocation decision

In the 1998 movie Sliding Doors, Gwyneth Paltrow’s character’s life splits into two parallel universes depending on whether or not she catches a train. The parallel universes that will be the focus of this article are the different outcomes that a member experiences based on their asset allocation choices.

Let’s assume we have a 50-year-old and the year is 2000. Their income is $75,000 per annum, increasing by 2% p.a. The starting balance in their super account is $200,000 and each year they contribute 9.25% of their income. Their investment choices are either an asset allocation to growth/defensive assets of 30/70 or 70/30. Which selection will result in the better outcome for the client?

Competing views on correct strategy

For the first 20 to 25 years of a client’s working life, their contributions to super dominate investment returns as the principal drivers of growth in balance. To quote former Treasurer Joe Hockey, the best thing that a client can do to grow their super balance over this period is to “get a good job that pays good money”.

However, once a client hits their mid-forties, investment returns dominate contributions as the key driver of growth. Further asset allocation is the dominant factor driving investment returns, having a bigger impact than either manager or security selection. Appropriate asset allocation becomes even more critical for this age group.

There are two competing schools of thought on the right thing to do later in life.

The first  is the ‘risk off’ school which reduces exposure to equities to reduce volatility and the risk to retirement date. Lifecycle funds are an automated approach to implementing this glide-to-retirement approach.

The second is the ‘risk on’ school which maintains an exposure to equities to deliver reasonable returns to enable investors to build a sufficient balance for a comfortable retirement. This view is that moving clients into a low risk environment locks in low returns.

So let’s have a look at the returns of our 30/70 and 70/30 options from 2000 to now as shown in Chart 1.

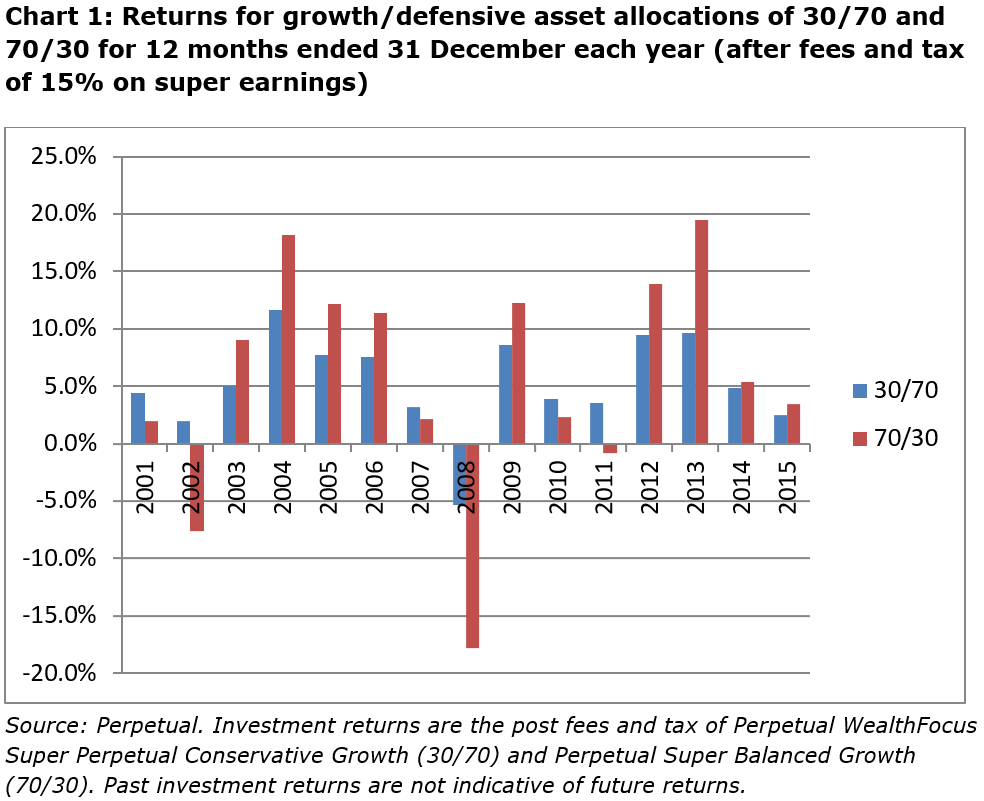
Our 70/30 client’s experience is more like the Gwyneth Paltrow character’s universe where she catches the train, arrives home in time to catch her boyfriend cheating, starts her own PR firm and falls in love with John Hannah. The 70/30 client has experienced both the highs (annual return of 19.5% in 2013) and the lows (annual return of -17.77% in 2008). Alternatively, our 30/70 client has probably slept better at night with only one negative annual return (-5.37% in 2008) and a high of 11.62% in 2004.

How do the two strategies compare?

So how have these two alternative paths of returns flowed through to our client’s balance at retirement at the age of 65? Somewhat inconclusively the balance of the client at the end of 2015 is much the same regardless of which path the client took, as shown in Chart 2.

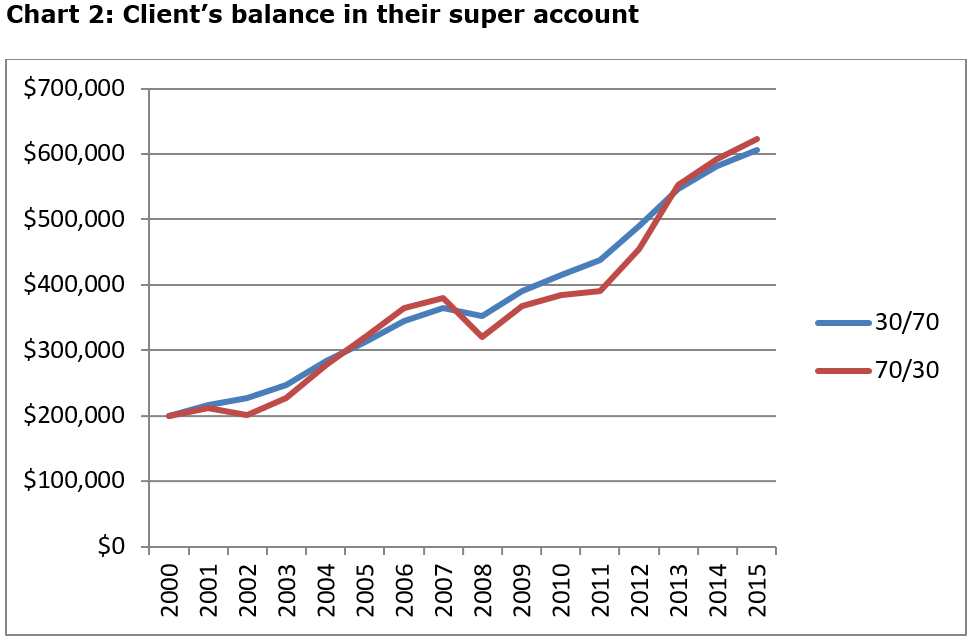
Over this period, the ‘risk off’ school could claim victory on the basis that the 30/70 path has delivered much the same level of return at a much lower level of volatility. The 30/70 asset allocation has delivered a superior risk adjusted return.

There is also some support for the 70/30 path. The client experienced the GFC seven years out from retirement, but still ended up slightly in-front at retirement in 2015. Over this period, while risk has not been rewarded, neither has it been punished.

Part of the decision on whether to reduce risk comes down to how equity markets perform over time. If each year’s return is essentially a random selection from a range of possible outcomes, then risk reduction is an important step to take.

However, if there is a relationship between year-on-year returns then long-term equity market returns may not be as risky as suggested by the volatility in 12-month return. Periods of bad returns tend to be followed by periods of better than average returns and vice versa. This can be seen over the 2000 to 2015 period with the tech wreck of 2002 being followed by strong returns from 2004 to 2006 and the GFC of 2008 being followed by the strong returns of 2012 and 2013. This view is that markets over react to both good and bad news, swinging between periods of under and over valuation.

Superannuation is the ultimate long-term investment strategy for an individual in that the timeframe is for the whole of the client’s life. The timeframe does not end at retirement, but continues (hopefully) for another 20+ years. If periods of poor returns are followed by periods of better than average returns, then clients have the capability (but not necessarily the willingness) to maintain exposure to risky assets as they approach retirement.

Asset allocation in the pension phase

The pension phase is complicated by the pension payments made from the member’s account. Let’s assume the member will have four alternate paths depending on their two asset allocation choices and two drawdown choices.

The member is 65-years-old and the year is 2000. They have accumulated a superannuation account balance of $500,000. They are commencing an allocated pension and have the choice of an asset allocation to growth/defensive assets of 70/30 or 30/70. Their desired income is 6% of their account balance, which they may choose to specify as a dollar amount (increasing by 2% p.a. for inflation) or as a percentage of their account balance.

The member is invested in the pension equivalent of the funds described in Chart 1 above. The following two charts compare the impact of the returns on the client’s account balance when they are drawing a pension.

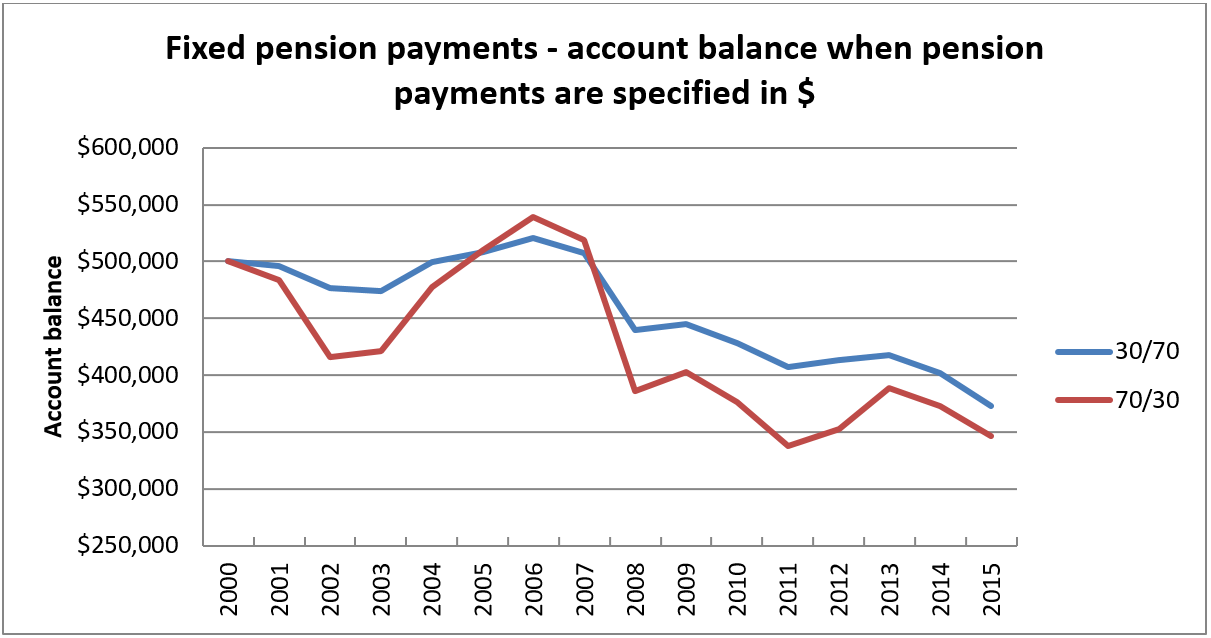
Pension payments specified as a set dollar amount, set initially as 6% of the member’s account balance in 2000. The dollar amount is increased by 2% pa for inflation.

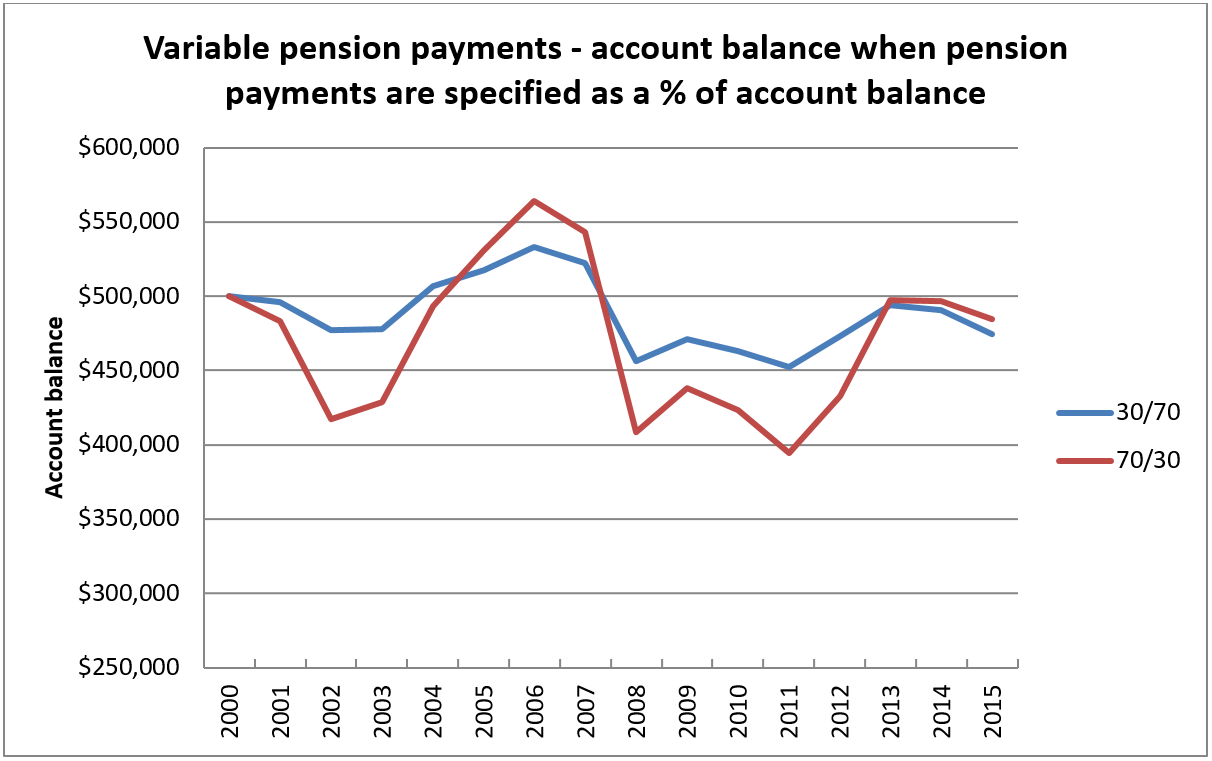
Pension payments reset each year to 6% of the account’s balance.

A set pension payment with an asset allocation that results in volatile returns is not a good combination for the member. The member is better off with the lower risk 30/70 allocation. However, with the variable pension payments, the member is better off with the higher risk 70/30 allocation.

The reason is that specifying the pension payment as a set dollar amount results in a ‘reverse dollar cost averaging’ effect where more units are sold when markets are down and less when markets are up. The impact of this is greater the more volatile the returns.

Alternatively, specifying the pension payment as a percentage of account balance works as an automatic stabiliser. Pension payments are lower when markets are down and higher when markets are up. This works in favour for members holding more volatile investments in terms of preserving their remaining balance.

Pension drawdown method affects asset allocation decision

Therefore, the method of pension drawdowns has an impact on the asset allocation decision. For clients requiring the certainty of income of a specified dollar amount, the exposure to growth asset should be reduced. For clients with the capacity and willingness to accept some volatility in income by specifying their pension as a percentage of account balance, a greater exposure to growth assets may be appropriate.


Gordon Thompson is Senior Product Manager Platforms at Perpetual Investments. This article is general information and does not consider the circumstances of any individual.


6 Comments
David
May 01, 2016

While the theory of drawing down a % amount from pension is useful to illustrate the "automatic stabiliser" effect, I'm not sure it is a practical option for self funded retirees.

If pension drawdowns are being used to fund living expenses, it is not easy for self funded retirees to be constantly adjusting their lifestyle in sync with the market movements of their fund. They need to use fixed $ amount drawdown to pay their bills.

Some self funded retirees do use the % drawdown method because they already have other cash reserves to fund their ongoing expenses at times when % based pension payments are lower. But in practice they are actually using fixed $ withdrawal from a total retirement savings pool including cash reserves, not just % drawdown from their superannuation pension fund.

Of course there are many retirees whose lifestyle expenses are largely covered by the age pension and they use minimum % withdrawal because they have to, not because they need to. But in these situations the superannuation pension fund is primarily being used as a tax effective savings vehicle for inheritances, not a retirement funding vehicle. That's when the "automatic stabiliser" effect becomes more relevant.

However this situation also raises the bigger question of whether our system should allow retirees to live off a supposed "safety net" provided by other taxpayers, before they have used up their own concessionally taxed retirement savings.

Jerome Lander
April 30, 2016

The whole problem with analyses like this is it assumes one only can only invest in plain vanilla equities or bonds. This ignores the substantial potential benefit of investing in alternatives and active managers, particularly when the long term prospective return from equities and bonds is low.

There are other options and there are better options than 30/70 or 70/30. The thing that will probably make the most difference is whether or not one uses these other options well, or whether one sticks with the same old options. The fact that both plain vanilla bonds and equities prospectively provide a mediocre risk/return regardless of how you mix them should result in an effort to consider alternative asset and capital allocations.

Been there B4
April 28, 2016

Looking at Chart 2 reminds me of the quote from Alice in Wonderland:

"If you don't know where you are going, it does not really matter how you get there"

Brian
April 28, 2016

It would be very easy for readers to draw the wrong conclusion by extrapolating the relative returns of 70/30 and 30/70 allocations from the period considered into the future.
Cash rates have fallen from 8% in 2008 to 2% now that has allowed bonds to return better performance than equities over that period. In most parts of the world interest rates are at record lows and in the next few years they will rise and the current meager return from bond funds will fall further. The return on equities is likely to be modest but there must be a high probability that a 70/30 allocation will have a much greater. return than a 30/70 allocation over the next 5 years at least.

Peter P
April 28, 2016

Without doing the math there is no way the fund would grow from 200k to 500k in 15 years on just $75k income with minimum contribs. Guess it's just an assumption to illustrate a point.

John De Ravin
April 28, 2016

Hi Peter
I think you will find that the projections require only a rather modest return assumption. At say 5%pa, the initial balance alone would more than double over 15 years, even without any additional contributions. Also, the additional contributions even without interest would exceed $100K. I would guess that the projections shown would be consistent with a stready rate of return of between 5% and 6% (after fees and taxes).
Cheers,
John


Leave a Comment:

RELATED ARTICLES

Is the Retirement Income Covenant really the right answer?

How super funds can better help with retirement planning

Invest in equities until you reach your sleeping point

banner

Most viewed in recent weeks

What to expect from the Australian property market in 2025

The housing market was subdued in 2024, and pessimism abounds as we start the new year. 2025 is likely to be a tale of two halves, with interest rate cuts fuelling a resurgence in buyer demand in the second half of the year.

The perfect portfolio for the next decade

This examines the performance of key asset classes and sub-sectors in 2024 and over longer timeframes, and the lessons that can be drawn for constructing an investment portfolio for the next decade.

Retirement is a risky business for most people

While encouraging people to draw down on their accumulated wealth in retirement might be good public policy, several million retirees disagree because they are purposefully conserving that capital. It’s time for a different approach.

Howard Marks warns of market froth

The renowned investor has penned his first investor letter for 2025 and it’s a ripper. He runs through what bubbles are, which ones he’s experienced, and whether today’s markets qualify as the third major bubble of this century.

The challenges with building a dividend portfolio

Getting regular, growing income from stocks is tougher with the dividend yield on the ASX nearing 25-year lows. Here are some conventional and not-so-conventional ideas for investors wanting to build a dividend portfolio.

How much do you need to retire?

Australians are used to hearing dire warnings that they don't have enough saved for a comfortable retirement. Yet most people need to save a lot less than you might think — as long as they meet an important condition.

Latest Updates

Property

Affordability issues cap further house price rises

If the RBA starts cutting rates, many believe house prices will rebound strongly. Yet, the numbers on affordability suggest prices can’t rise much further without making housing impossibly expensive for most Australians.

Superannuation

How to shift into pension mode

How do you start accessing your super funds when you stop working, or maybe even before you stop working? This covers the basics, including how to switch your super accumulation account to an account-based pension.

Taxation

Reform overdue for family home CGT exemption

The capital gains tax main residence exemption is no longer 'fit for purpose', due to its inequities, inefficiency, and complexity. Here are several suggestions for adapting or curtailing the concession.

Investment strategies

The two key risks facing investors

In 2024, markets were buoyed by decent economic growth and US rate cuts, even as valuations became stretched. This year, more resilient portfolios may be needed to tackle risks from higher bond yields and market concentration.

Superannuation

Why systemic risks from ‘Big Super’ may be overplayed

What are the implications of ‘Big Super’ for our economy, financial markets and population? New research looks at the beneficial, detrimental and debatable aspects, spanning current impacts and potential future developments.

Property

What AI’s ‘Sputnik moment’ means for data centres

What we know about DeepSeek so far could be a mixed bag for data centre owners like Goodman Group. However, it's worth remembering that AI adoption isn't the only thing that matters to the industry's outlook.

Gold

Will 2025 be another banner year for gold?

Last year, gold surged 38% higher in Australian dollars, fuelled by investment demand and global risks. This year's outlook suggests potential for continued gold strength amid geopolitical uncertainties and currency vulnerabilities.

Sponsors

Alliances

© 2025 Morningstar, Inc. All rights reserved.

Disclaimer
The data, research and opinions provided here are for information purposes; are not an offer to buy or sell a security; and are not warranted to be correct, complete or accurate. Morningstar, its affiliates, and third-party content providers are not responsible for any investment decisions, damages or losses resulting from, or related to, the data and analyses or their use. To the extent any content is general advice, it has been prepared for clients of Morningstar Australasia Pty Ltd (ABN: 95 090 665 544, AFSL: 240892), without reference to your financial objectives, situation or needs. For more information refer to our Financial Services Guide. You should consider the advice in light of these matters and if applicable, the relevant Product Disclosure Statement before making any decision to invest. Past performance does not necessarily indicate a financial product’s future performance. To obtain advice tailored to your situation, contact a professional financial adviser. Articles are current as at date of publication.
This website contains information and opinions provided by third parties. Inclusion of this information does not necessarily represent Morningstar’s positions, strategies or opinions and should not be considered an endorsement by Morningstar.