[Editor’s Note: Each year, Mary Meeker of venture capital firm Kleiner Perkins Caulfield Byers (KPCB) produces a report on Internet Trends. It has become the ‘must-read’ for the technology industry, and the 2016 Report fills 213 pages, linked here. There is so much in it, including global macro trends, it’s almost impossible to summarise, and the following article picks out some highlights.
It’s worth flicking through the report in full while drinking a strong cup of coffee. Look for:
- Slide 10, global smartphone usage
- Slide 31, global debt by type
- Slide 38, five epic growth drivers of the past 20 years
- Slide 45, advertisers still spend too much on legacy media
- Slide 59, the rapid rise and impact of Millennials
- Slide 70, how quickly internet retailers reach $100 million in annual sales
- Slide 78, massive increase in user-shared videos
- Slide 99, growth in messaging with more detail
- Slide 116, voice is becoming the new computer interface
- Slide 132, computing industry inflection points, obvious with hindsight
- Slide 148, can technology make the US the centre of the auto industry again?
- Slide 162, the rise of China’s service industry
- Slide 186, major internet incumbents still growing
- Slide 195, global data growing while infrastructure costs falling.
The report confirms many technologies are moving from prototype to mainstream and the challenge of staying on top of the trends.]
Technology is disrupting traditional business models globally, and US and Chinese companies are leading the way. The pace of change is only going to accelerate, with artificial intelligence, 3D printing, and blockchain security likely to continue to disrupt manufacturing, finance, services and much else. Australian investors can benefit by moving into companies at the vanguard of these technologies.
The report found that, of the 20 most valuable global tech companies in 2015, 12 were American, seven were Chinese and one was Japanese. The US companies represented 76% of the group’s total market capitalisation and 87% of their revenue. Of the dozen companies based in the US, only one resided outside of Silicon Valley.
Global internet usage reaches 3 billion
The number of global internet users has recently hovered around the 3 billion mark, due to slower global GDP growth. However, it will increase over time as affluence increases in emerging economies and with more communications infrastructure investment globally.
Mobile ads will grow by tens of billions of dollars in the coming years and will mostly line the pockets of Facebook and Google. The two Silicon Valley giants account for 76% of all US internet advertising. Google’s share of the pie is far larger, but Facebook is growing more rapidly. Ms Meeker sees mobile advertising growing by another $US22 billion in the US because the time consumers spend on mobile devices (about 25%) is more than double the share of ad dollars the platform receives. (One concern of note is that 420 million smartphone users utilise ad-blocking technology.)
Alphabet, Google’s parent, controls 12% of all money spent globally on media advertising, according to Adweek. No company has ever controlled such a large percentage of this market in the past. In 2015, Google derived 54% of its $US75 billion in revenue from overseas.
Silicon Valley continues relentless global expansion
Newsweek recently reported that the number of internet users is growing faster in India than anywhere else in the world. Almost all of that growth is from people using mobile phones. Facebook currently owns India’s top three phone apps (Facebook, WhatsApp and Facebook Messenger). Additionally, almost all of India’s mobile phones run on either Google’s Android or Apple’s iOS operating systems. That means a significant proportion of India’s dynamic growth is directly benefitting Silicon Valley companies. That scenario is playing out in almost every country. In recent years, this trend has moved beyond pure technology and into businesses that used to be non-digital and entirely local. Uber is a good example. The company takes a 20% cut of the fare for every ride in every country it operates in. Previously the money would have stayed in the home market.
More than 3 billion photos are shared everyday on Facebook, Facebook Messenger, Instagram, Snapchat and WhatsApp. This number has more than doubled in the past two years. The report also highlights the rapid rise of Snapchat in just a few years. While there are plenty of other photo sharing platforms out there, they are all controlled by Facebook. The world is also creating and sharing more videos online via Facebook and Snapchat. Now advertisers are looking for ways to co-opt these videos to reach potential customers. In general, the Meeker Report illustrates the dominance of Facebook’s messaging apps and flagship social network platform – we are living in the age of Facebook.
The number of global smartphone users is still growing, although the rate of growth has been slowing in Western countries. In 2007, only 34% of smartphone users resided in the Asia-Pacific region; that figure is now 52%. In North America and Europe, the biggest gains appear to be behind them. This has big implications for Apple, which relies on the iPhone for most of its profits. Apple has been losing market share to some of its Asian competitors.
Crossing from prototype to mainstream
A new generation of technologies are moving from prototype to mainstream and challenging the status quo in a number of industries. Over the past decade, smartphones, social networks, and cloud computing have combined to usher in the current tech era, and the next 10 years are likely to be just as revolutionary.
Picking winners in emerging technology is always difficult. The pace of change can disrupt even the big tech names of today so you need to be vigilant. But for now Facebook and Alphabet in the US, and the e-commerce business Alibaba in China, are three stocks worth considering in growth portfolios. The 12-month forward PE ratios of those stocks are 29x, 19x and 24x respectively, which should be more than justified by their future earnings growth rates.
Marcus Tuck is Head of Equities Research at Mason Stevens. This article is general information and does not consider the personal circumstances of any individual.
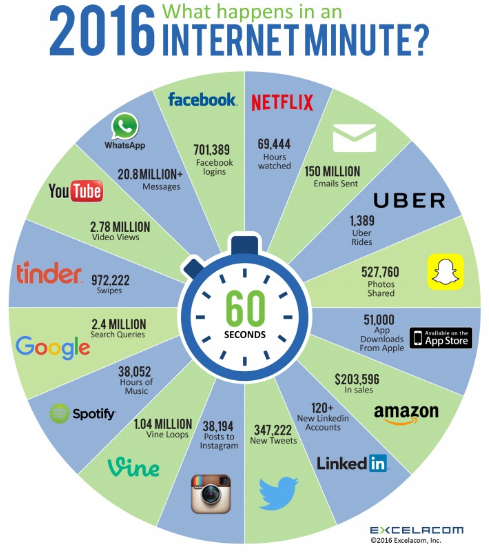
The following graphic from Excelacom is further evidence of the dramatic impact of the internet on our everyday lives.