Capitalisation rates, commonly known as ‘cap rates’, are a fundamental metric in Australian property investing. When a commercial property is sold, two pieces of information will be widely reported. Firstly, the amount the property sold for and secondly, the cap rate. Often properties will be compared by their respective cap rates. Reports will often comment on the ‘implied cap rates’ of different property securities. However, this seemingly simple and ubiquitous measure can be far more complex to use when comparing different types of properties.
What is and isn’t in a cap rate
Whilst different market participants may mean different things when referring to a cap rate, the Property Council of Australia (PCA) defines a cap rate as a property’s net operating income (NOI) divided by its property value estimate. For example, if a property generates an annual NOI of $500,000 and is valued at $10 million, the cap rate would be 5%. A purchaser might assume that they would receive a cash flow yield of 5% plus any rental growth that may occur. This isn’t necessarily the case and ignores key considerations.
Capital Expenditure (Capex):
Commonly, properties require meaningful ongoing investment, which isn’t reflected in the NOI used to calculate cap rates. This investment is known as capex and comes in many different forms. It may be maintenance capex, which refers to significant replacements or additions to maintain the standard of an existing building. For office properties, this may include replacing lifts or air conditioning units, each of which may need a full replacement as often as every 15 years. For shopping centre properties, capex may include items such as escalators or shared facilities such as bathrooms. Maintenance capex is not directly reflected in increased rent and is commonly used to ‘maintain’ the relevance of an existing building. This amount is often referred to as a percentage of a building’s value. For example, if a building worth $100 million requires maintenance capex of $500,000 per year, it is common to say it requires 0.5% (or 50 basis points) of maintenance capex.
Leasing Incentives:
To attract and retain tenants, commercial property owners often provide ‘incentives’ to prospective and renewing tenants. These incentives can take many forms, but are commonly provided as rent-free periods, or contributions to a tenant’s fit-out. The size and form of incentives varies greatly between different property types. Incentives are commonly quoted as a percentage of the total rent to be paid over the tenant’s lease period. For example, if a tenant agrees to a 10-year lease for $100,000 per year, a 20% incentive would mean that $200,000 of benefits are provided to the tenant. Rent, less any incentives, is called ‘effective rent’ and in the above example effective rent would be $80,000 per year. Rent excluding incentives is called ‘face rent’. It is typically face rent that is used to calculate the NOI used in a cap rate.
Whilst not the subject of this article, it is worth noting that lease structures including term and rent reviews, as well as tenant quality are not considered in a cap rate. Buildings with longer leases, higher fixed rent increases and better tenant quality tend to attract lower cap rates than the alternative.
Now and then
In a past generation, institutional grade commercial property primarily consisted of office, retail and industrial property. Approximate leasing incentive and maintenance capex amounts across these subsectors 15 years ago can be seen in the table below:
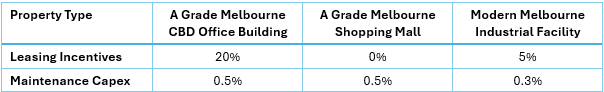
Whilst there are some differences between the amount of cash flow leakage, the difference between property types is not enormous. Whilst industrial properties faced limited cash flow leakages, market rental growth had been extremely low for a long period. It may not have been perfect but comparing cap rates across these property types 15 years ago was not a terrible way to assess relative value.
Beyond any changes to leasing incentives and maintenance capex requirements, today’s listed property sector is much broader than it used to be. Alternative property types such as healthcare, social infrastructure, petrol stations and long WALE sale-and-leaseback properties are all part of the institutional investment landscape. Many of these property types are commonly leased in an owner favourable “triple-net” manner. A triple-net lease means a tenant is responsible for property taxes, building insurance and maintenance capital expenditure across the life of the lease.
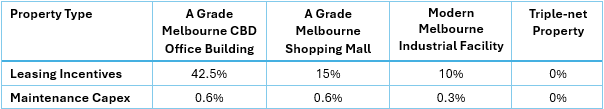
A revised table approximating today’s leasing incentives and maintenance capex, including triple-net properties, can be seen below:
Mind the gap
It is clear when comparing the above tables, that the dispersion in incentives and capex has widened materially. In the case of an A grade office building, the gap between the building’s cap rate and its true cash flow yield is vast. The chart below demonstrates this visually for an office building with a 6% cap rate:
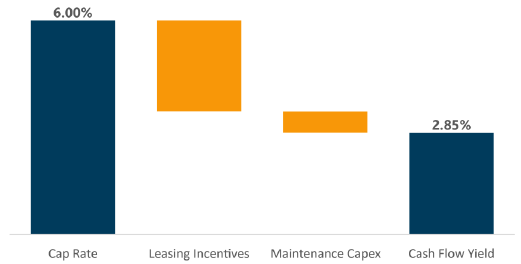
As can be seen, the cap rate in no way resembles the true cash flow of owning an office building, with more than half of the NOI received (used in calculating the cap rate) lost to capex and incentives.
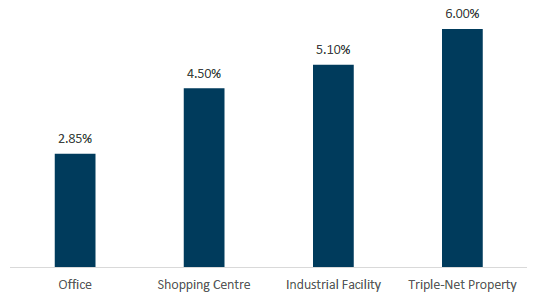
Consider the four assets in the above table. In this example, each has a cap rate of 6%. The chart below shows the cash flow yield of each:
What to do?
Phoenix actively considers the factors affecting cash flows (among others) and explicitly forecasts longer term capex and incentives that property owners will be required to pay. It is these cashflows that determine value, not next year’s dividend or simply observing a cap rate.
A comparison of Dexus (DXS) and Charter Hall Social Infrastructure REIT (CQE) shows the importance of looking beyond headline cap rates and how this affects how Phoenix manages the portfolio.
DXS is predominantly an owner of high quality office properties across Australia. CQE is predominantly an owner of smaller properties leased to childcare providers on triple-net leases. CQE’s cash flow is boosted by a lack of incentives and capex. Childcare property rent is also an income stream heavily supported by the government, with support for funding of the sector a politically bipartisan issue. As at period end, DXS’ office cap rate implied by its share price was greater than 8.3%. CQE’s implied cap rate was more than 6.8%. If one were to merely compare cap rates, DXS would be the more attractive investment opportunity. It, however, faces significant cash outflows (in the form of capex and incentives) beyond what is measured in a cap rate. As such, Phoenix has held no position in DXS for some time and holds an overweight position in CQE.
The detail is important
Cap rates have the benefit of being simple. In the past they were also a reasonable way to compare property.
As incentives and capex levels have diverged between different properties, merely looking at cap rates has become a less appropriate way to consider the relative attractiveness of different properties.
By developing a more nuanced understanding of what's truly "in a cap rate", investors can make more informed decisions. Remember, the devil is always in the details, and in real estate investing, those details often lie beyond the simple cap rate calculation.
Stuart Cartledge is Managing Director of Phoenix Portfolios, a boutique investment manager partly owned by staff and partly owned by ASX-listed Cromwell Property Group. Cromwell Funds Management is a sponsor of Firstlinks. This article is not intended to provide investment or financial advice or to act as any sort of offer or disclosure document. It has been prepared without taking into account any investor’s objectives, financial situation or needs. Any potential investor should make their own independent enquiries, and talk to their professional advisers, before making investment decisions.
For more articles and papers from Cromwell, please click here.