Register For Our Mailing List

Register to receive our free weekly newsletter including editorials.

Home / 528

Even Warren Buffett lost his edge 20 years ago

The world's best investor, Warren Buffett, has suffered from the same disease that plagues every other successful fund manager in the world - fading out-performance over time. My analysis here is not covered in any of the books or articles on Buffett that I have seen. 

Even Warren Buffett peaked long ago

In my last article (1), I showed how even the very small proportion of fund managers that do add value by beating their market benchmark over a decent time period, that their out-performance always fades over time.

After studying hundreds of funds, my conclusion was:

"All active fund managers peak early in their careers (in terms of beating their market index anyway) and then it is all downhill from there. Even for the best in the world."

This includes the greats like Warren Buffett, Peter Lynch, George Soros, John Templeton, and local ‘stars’ like Kerr Neilson, Hamish Douglass, and everybody else. The reasons are different in each case.

Yes, the pattern is the same for Warren Buffett.

I am a long-term shareholder in Berkshire Hathaway, so I have a vested interest in measuring its performance. It has beaten the S&P500 total return index by an astounding 10% pa since May 1965 when Buffett took over, but most of that out-performance was in the early decades.

Berkshire Hathaway has not added any value against the S&P500 index since 2002. Its out-performance fade curve is the same as other value-adding share funds in Australia and other markets.

Tracking performance decay over time

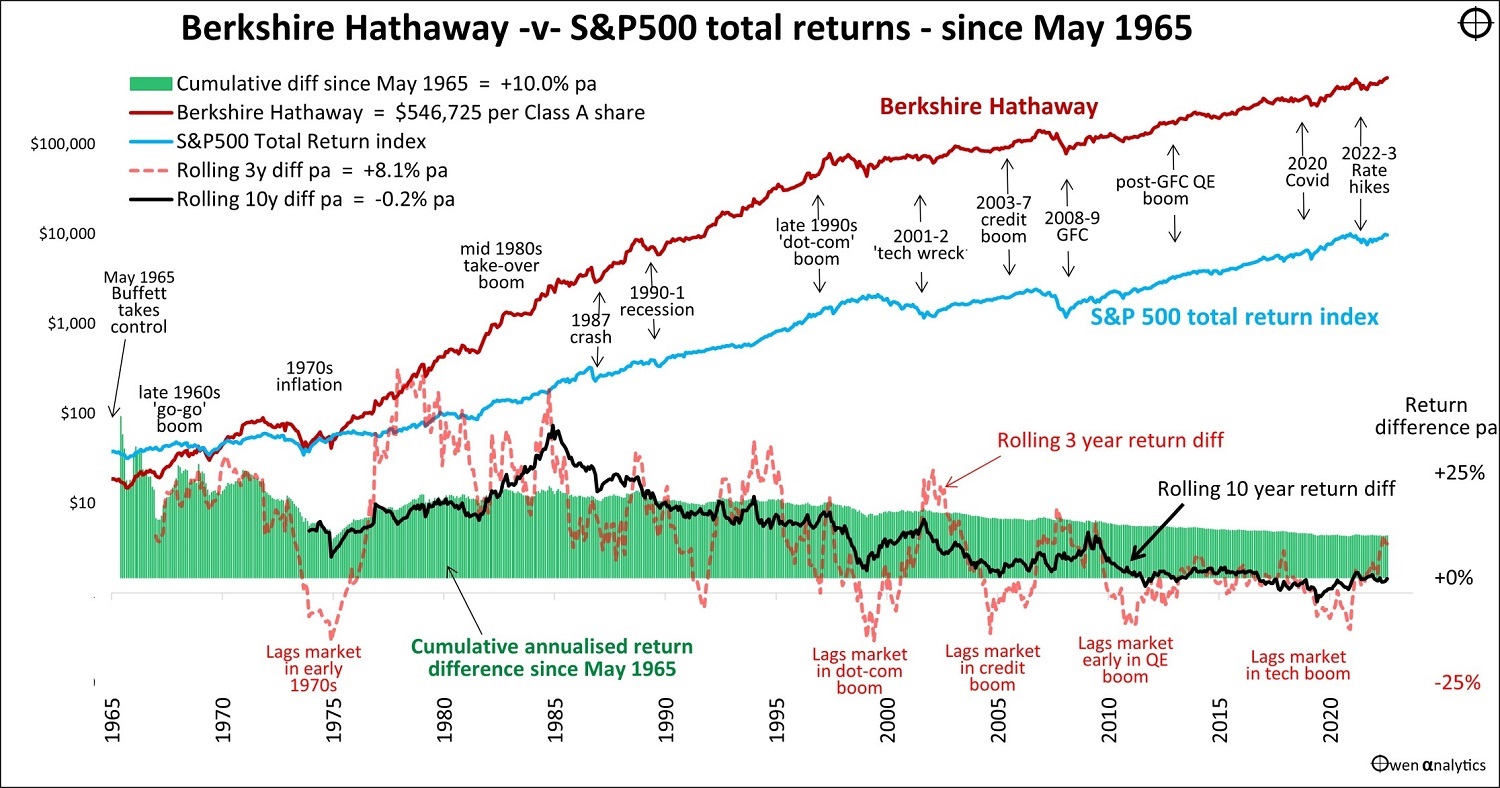
Here is my chart for Berkshire Hathaway since May 1965 when Buffett took control.

Click to enlarge.

The red line is the Berkshire’s share price. Since 1965, the company has paid no dividends and has reinvested all earnings, so the share price is essentially the ‘Total Return’ series. The shares have not split over the period and the price of BRK Class A shares has grown from $12.37 to $546,725 per share at the end of August 2023.

The blue line is the S&P500 total return index. This is the most appropriate benchmark because Berkshire’s investments have always been US companies (listed and unlisted), with few exceptions (notably Chinese car maker BYD).

The black line shows annualised rolling 10-year excess returns above the benchmark. This is our main historical measure for long-term investors.

The orange dotted line is the annualised rolling 3-year excess returns above the benchmark. This is a good way to see performance through different cycles and market conditions.

Beat the market by 10% pa since inception

The green bars in the lower section of the chart show the annualised cumulative excess returns over the benchmark since May 1965. This is the annualised ‘since inception’ out-performance over time. It has beaten the S&P500 total return index by 10% pa compound over 58 years! No other fund manager in history has ever come close to this over such a long period.

Warren Buffett, along with his side-kick Charlie Munger, is without doubt the greatest portfolio share investor in history. I use the term ‘portfolio investor’ to differentiate him from founder/owners like Rockefeller, Carnegie, Musk, Bezos, Gates, etc. They built their own companies, but Buffett invested in other peoples’ companies, which is a different skill.

Buffett put just $100 of his own money into his first fund in 1956. He earned the rest of his stake by taking his out-performance fees in units in his fund, rather than cash, and then rolled it into Berkshire Hathaway in 1965. So, he turned his original $100 in 1956 into $120 billion today.

Peaked in 1965 (year one) then downhill

Like all active fund managers, Buffett peaked early. In fact, he peaked in the very first year in Berkshire. He beat the S&P by a whopping +37% in 1965, and that was the peak of the annualised cumulative value add (green bars).

1965 was actually not his best individual year. He had several better years – and they were all early on. He beat the market by +105% in 1976, +84% in 1979, +67% in 1968, +66% in 1971, +54% in 1977, +53% in 1989. These were partially offset by some poor years in between, so the cumulative ‘since inception’ peak was in 1965.

It was all downhill from the early peak, albeit still generating higher returns than anyone else in history.

  • By the end of the 1960s, the annualised cumulative value add was +27% pa.
  • By the end of the 1970s it was +19.7% pa.
  • By the end of the 1980s it was +20.4% pa.
  • By the end of the 1990s it was +15.1% pa.
  • By the end of the 2000s it was + 13.1% pa.
  • By the end of the 2010s it was +10.5% pa.

Today, the annualised cumulative value add is down to ‘just’ 10% pa. What’s not to like? As a prospective investor you might say: “Wow the since inception return is still 10% pa over 58 years. It should still be a great investment!”

That's why fund managers and their sales reps love talking about 'since inception' returns. But they are meaningless.

The problem with ‘since inception’ numbers

This highlights the big problem with ‘since inception’ numbers. The great-looking ‘since inception’ return of 10% pa masks the fact that most of that out-performance was generated in the early years, half a century ago.

We see a clearer picture of performance by looking at returns per decade:
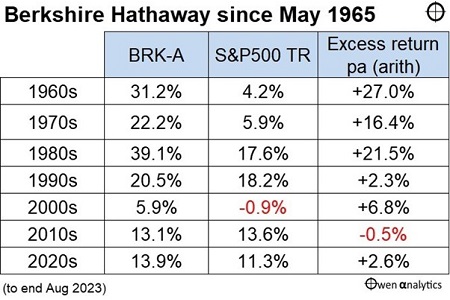
In the 1990s, it added almost no value as Buffett lagged the market by deliberately avoiding the crazy ‘dot-com’ boom. This earned him a lot of derision at the time but he was vindicated when he added value in the 2000s by avoiding the ‘tech wreck’. However, virtually no value was added in the 2010s and 2020s.

Rolling 10-year value-add

The black line (rolling 10-year value added pa) is the key. It shows rolling 10 year annualised value add is currently zero. In fact, the black rolling 10-year value add line has been running at around zero for the past 10 years since 2012, because it has added no value at all since 2002.

That’s a long time going nowhere. It didn’t actually go nowhere of course. It has gained 650% since 2002, but so has the passive S&P500 total return index. That’s better than the 490% return from the Australian market over the same period.

Rolling 3-year value-add

The orange dashes (rolling 3-year value added pa) is a good way of showing where the value is added or detracted through market cycles.

Buffett’s pattern has been very consistent over seven decades. His ‘value investing’ strategy lagged the overall market in booms (by avoiding fads/bubble stocks) but then added value in the busts when the fads/bubble stocks collapsed. The only exception was poor returns in the 1973-4 crash, but that was recovered big time in the late 1970s and 1980s.

True to form, Buffett was also vocal in avoiding the most recent 2020-21 Covid stimulus tech bubble, and the share price lagged the market (orange dash line below zero) as expected. There were also some poor deals in the recent cycle – notably Kraft-Heinz, and the disastrous Airline bets in 2020.

In the rebound over the past year, performance has improved, thanks to huge bets on Apple and oil/gas.

Reasons for performance fade

Buffett and Munger certainly have not succumbed to the problems that afflict many older fund managers, such as selling out, no longer lean and hungry, family problems or diversions, buying football teams, hubris, ego, etc, etc.

In their case, there are probably two reasons:

  1. Berkshire has become too large and they cannot deploy the huge sums effectively without moving markets.
  2. It has too much cash, which is largely the result of the first problem.

Am I a seller? Probably not until my SMSF is in tax-free pension mode, so I avoid CGT on sale! 

Same pattern of fading out-performance

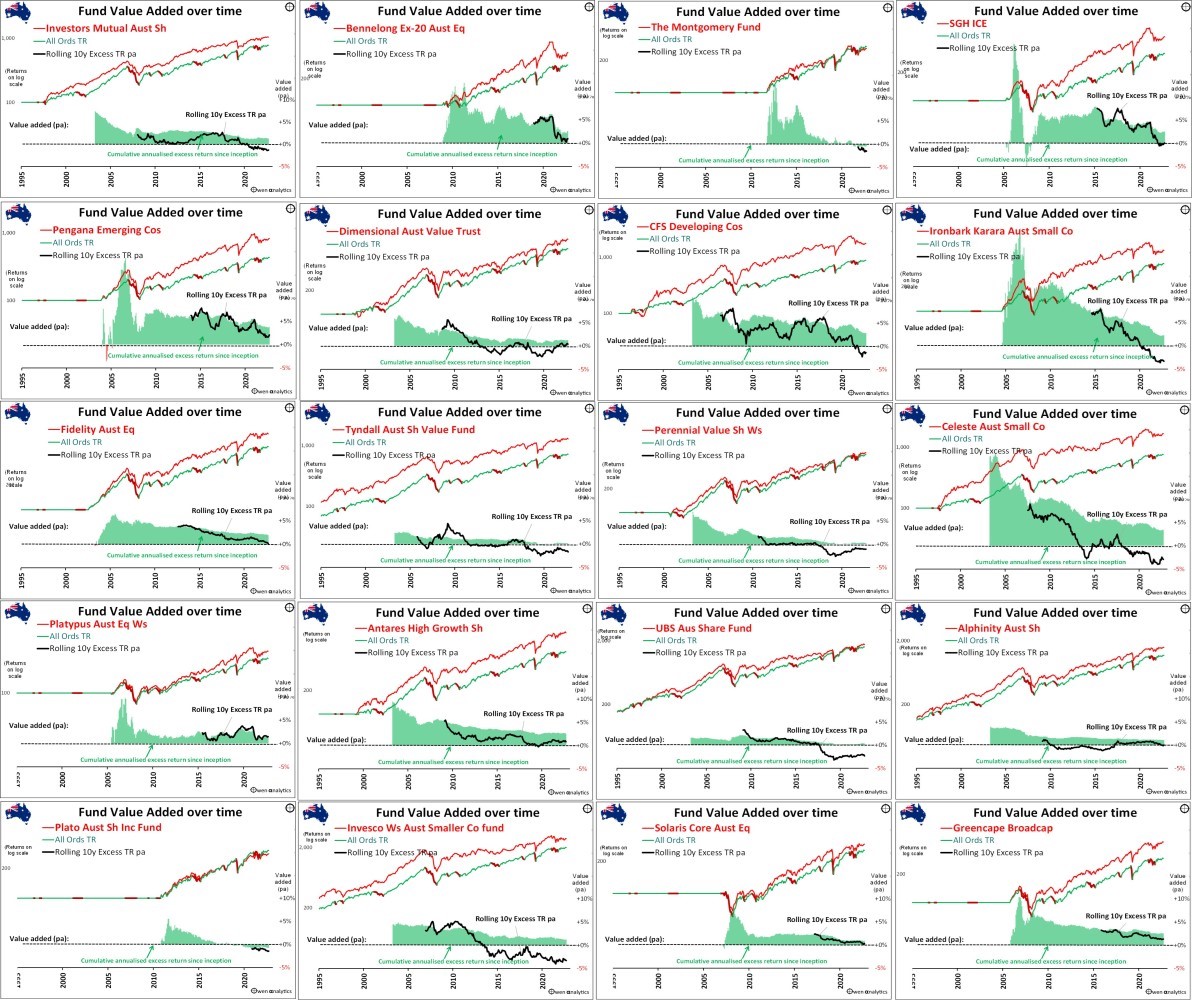
For reference, here is a copy of the charts on 20 ‘value-adding’ Australian share funds. Just as with Berkshire Hathaway, the general pattern is the same. Excess returns (green bars) start out with a bang early in the fund’s life, but then fade over time in every case.

The difference is of course that Buffett and Munger added a lot more value for a lot longer than anyone else.
Three stages of out-performing fund managers

Here is the chart from my last article, outlining the three stages in the life of an out-performing fund:
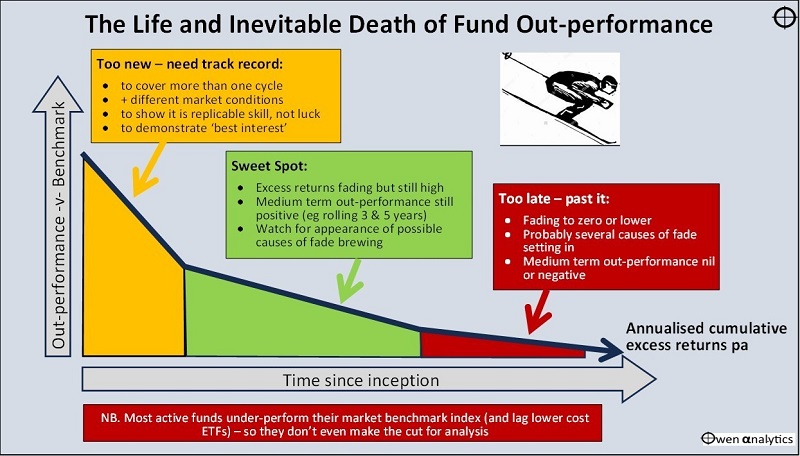
Berkshire Hathaway was in the Sweet Spot for decades but has probably been in Stage 3 since the early 1990s. The orange 3-year value-add line on the main chart shows there are certainly some short-term opportunities through the cycles, but as a long-term investor, the black 10-year value-add line has flat-lined.


(1) OwenAnalytics Newsletter is currently published on LinkedIn. ‘Few active fund managers add value, but even value-adding managers almost always fade over time.'

Ashley Owen, CFA is Founder and Principal of OwenAnalytics. Ashley is a well-known Australian market commentator with over 40 years’ experience. This article is for general information purposes only and does not consider the circumstances of any individual.


16 Comments
Andrew
September 12, 2024

Buffett made his money by operating an insurance and unregulated financial services company (basically a shadow bank). He used the cash float (insurance premiums) as leverage to buy companies with strong cash flow. His stock picking skills were totally unremarkable. He missed literally every great investment of the past 40 years

Kevin
October 02, 2023

The "owner builder" reference is a good point.I was always baffled why Buffett never bought Wal Mart.I think he did reference it in a long ago annual report,he did the 'see if I can pick it up for 10 cents a share cheaper bit. Then it was a case of not buying them "my thumb sucking cost us $billions,I'm too scared to work out how many billions".Fortunately I can blame Charlie for that one.
Digging out our own "owner builder," Frank Lowy.The book sent to shareholders ( me) in 2000, Westfield,the first 40 years.
Sourced ASX/ S+P investor services.

1960 $1,000 on IPO

1970 $16,850. ( 32.64% CAGR )

1980 $236,350. ( 31.42%. CAGR )

1990 $3.6 million. ( 31.38%. CAGR )

2000 $109 million. ( 33.64% CAGR )

I think when sold off it had grown to $400 million or so ( 2016or 17)

Came out of the blocks like a jet and turned into a dead snail.You can live off the dividends from Scentre group for a long time into the future.I think Unibail only paid 1 dividend,perhaps 0 dividends then Covid etc came in. The popular opinion was Frank timed it perfectly,the rise of Amazon.
Perhaps the kids just thought I hope he sells it,how the hell can anybody follow that.Who would be crazy enough to even want that job.
The power of a highly focused individual.

ashley owen
October 03, 2023

hi kevin - yes Westfield is another story for another day. There were 10 different Westfield entities over the years. Was a tremendous investment if you stuck to the main development co and avoided all of the trusts. My main lesson from Lowy was that he was the master timer - always follow the Lowy money. If Lowy was selling, you don't want to be a buyer. He sold out of the development co at the top, then he also sold out of the retail trust at the top.
I will publish the Westfield story in the coming months
cheers
ashley

Kevin
October 02, 2023

Good article,perhaps a little harsh but facts are facts. Buffett has been saying for decades that the law of big numbers always slows things down,including him.

The tortoise and the hare,as you say,what's not to like.Start off as a hare and slowly become a tortoise,it's great.

As an example BRK and CBA. BRK turns 8K into $550K over the same period as CBA turns $6K into $600K.Retire and dividend income from CBA is great,split one BRK A into 1500 BRK B and sell 52 a year for income ( 52 X $350).

Coming out of the starting blocks quickly is magnificent,the tortoise will never make up the gap,and the gap continues to get wider.

I don't know how the conversion would go in a super fund,would it be a CGT event?
CBA grows as a tortoise ,and BRK also grows as a tortoise,28 years to still partake in the growth of the companies.Close to 29 running down BRK at 52 shares a year.After retiring,and 29 years later, possibly not playing with a full deck of cards anyway as old age kicks in.

Bill Novac
October 02, 2023

The S&P 500 returned about 8% annualised between 2002-2023 (excluding dividends). Berkshire Hathaway returned 10-11% annualised between 2002-2023. Berkshire doesn't pay a dividend, so the S&P 500 is likely to be ahead during this period (marginally). However, this article assumes you timed the market perfectly and bought the S&P 500 in 2002 - at the bottom of the 2000-2002 bear market (when the S&P declined by almost 50%). Meanwhile Berkshire Hathaway's stock gained 65% during this same period of time (2000-2002), crushing the S&P 500. Saying Berkshire has added virtually no value between 2010 and 2020 is a little unfair. The last 10-15 years haven't been easy for Buffett. Low rates and easy money have resulted in one of the longest bull markets in history. Momentum traders and meme stock traders were outperforming disciplined value investors, and Governments weren't helping, by artificially stimulating a slowing global economy. Now that things are normalising and monetary conditions are tightening, I doubt any index fund will outperform Berkshire Hathaway. The way Berkshire is structured is unique to other funds - it allows Buffett to move cash from slow growing businesses to other areas/investments that have greater potential for growth. Berkshire can do this without taking a tax hit. Lastly, there is a reason Buffett and Berkshire hold more cash than most. Their insurance division needs to be equipped to pay out possible catastrophic insurance losses. Also, with economic conditions deteriorating and global markets faltering, Buffett would be quite happy holding his stockpile of cash.

ashley owen
October 04, 2023

hi bill,
thanks for the comments. The article wasn't intended to assume you "timed the market perfectly". 2002 just happened to be when it ceased to beat the market (avoiding the dot com boom then avoiding the tech wreck).
The article was not intended to replace or summarise the dozens of books and thousands of articles written about Berkshire/Buffett. Just a simple observation as a shareholder.
The editors edited out the part where I concluded that, although I have received index-like returns, the volatility has been lower, so I got a Markowitz 'free lunch'. You can see the full story (plus the background/lead-up stories) in my LinkedIn.
Maybe we'll catch up in Omaha one day?
cheers
ashley

Graeme
October 02, 2023

And these are the better long term performing funds. Many (most?) of the funds that perform poorly from the word go no longer exist. These usually either disappear quickly as managers don't like the negative advertising associated with them hanging around and close them, often suggesting you move to their latest wonder product. Or they die a slow death as redemptions exceed inflows.

Patrick Kissane
October 02, 2023

A simple table showing Berkshire Hathaway's performance versus the S & P 500 for 1,3,5,7 and 10 years would be much more meaningful and useful.

Adam
October 01, 2023

Index!! The chance of getting it wrong and picking the active manager that is crap, means just go index. After costs why take the risk, I would love a list of all the active managers that started in May 1965 and did 10% less than the index consistently.

Rick
September 28, 2023

Great article. I’m sure Warren and Charlie spend an enormous amount of their time and energy in pouring over company reports, looking for opportunities to invest their enormous cash reserves as well as managing the substantial portfolio of companies they own. With all due respect to 2 of the worlds greatest investors, I think I will shift my focus to a simpler indexed investing approach for the core of my portfolio (thanks Jack Bogle). After reading this article I will be less concerned with my investment choices, and will likely have more time to to do other things : )

Ramon Vasquez
September 28, 2023

Thank you very much for proof of my long-term theory derived from observations of a non-statistical point of view .

Best wishes , Ramon Vasquez .

Sean
September 28, 2023

Very interesting and great Analysis! Many asset managers out there still dining on past glories.

ashley owen
October 04, 2023

yes, they're buying football teams and yachts with your money!
ao

Philip Carman
September 28, 2023

When you're managing so much money it's almost impossible to 'beat the market'...and yet BKHa does just that - ESG issues aside. I'm not a fan of managed funds and the decline in (out)performance is almost a given if they are successful at raising money, but doing it yourself creates many more problems to deal with.

Jack McCartney
September 28, 2023

Not many would know that Berkshire Hathaway has amassed over 100 corporate and environmental fines in the last 5 years. Such a high level of fines matters because our sustainability ESG data shows there is a positive correlation between longer term results and doing the right thing i.e. but for Buffett its cheaper to pay the fines than dealing with the issues, but this approach doesn't work in the long term as Ashley has demonstrated.

ashley owen
September 30, 2023

yep. just a cost of doing business - like very other company. You pay your fines, then you move on.


Leave a Comment:

RELATED ARTICLES

The ASX's 16-year drought: a rebuttal

The BIG picture: portfolios perform for the passive and patient

Investing for generations

banner

Most viewed in recent weeks

Australian stocks will crush housing over the next decade, one year on

Last year, I wrote an article suggesting returns from ASX stocks would trample those from housing over the next decade. One year later, this is an update on how that forecast is going and what's changed since.

What to expect from the Australian property market in 2025

The housing market was subdued in 2024, and pessimism abounds as we start the new year. 2025 is likely to be a tale of two halves, with interest rate cuts fuelling a resurgence in buyer demand in the second half of the year.

Howard Marks warns of market froth

The renowned investor has penned his first investor letter for 2025 and it’s a ripper. He runs through what bubbles are, which ones he’s experienced, and whether today’s markets qualify as the third major bubble of this century.

The perfect portfolio for the next decade

This examines the performance of key asset classes and sub-sectors in 2024 and over longer timeframes, and the lessons that can be drawn for constructing an investment portfolio for the next decade.

9 lessons from 2024

Key lessons include expensive stocks can always get more expensive, Bitcoin is our tulip mania, follow the smart money, the young are coming with pitchforks on housing, and the importance of staying invested.

The 20 most popular articles of 2024

Check out the most-read Firstlinks articles from 2024. From '16 ASX stocks to buy and hold forever', to 'The best strategy to build income for life', and 'Where baby boomer wealth will end up', there's something for all.

Latest Updates

Investment strategies

The perfect portfolio for the next decade

This examines the performance of key asset classes and sub-sectors in 2024 and over longer timeframes, and the lessons that can be drawn for constructing an investment portfolio for the next decade.

Shares

The case for and against US stock market exceptionalism

The outlook for equities in 2025 has been dominated by one question: will the US market's supremacy continue? Whichever side of the debate you sit on, you should challenge yourself by considering the alternative.

Taxation

Negative gearing: is it a tax concession?

Negative gearing allows investors to deduct rental property expenses, including interest, from taxable income, but its tax concession status is debatable. The real issue lies in the favorable tax treatment of capital gains. 

Investing

How can you not be bullish the US?

Trump's election has turbocharged US equities, but can that outperformance continue? Expensive valuations, rising bond yields, and a potential narrowing of EPS growth versus the rest of the world, are risks.

Planning

Navigating broken relationships and untangling assets

Untangling assets after a broken relationship can be daunting. But approaching the situation fully informed, in good health and with open communication can make the process more manageable and less costly.

Beware the bond vigilantes in Australia

Unlike their peers in the US and UK, policy makers in Australia haven't faced a bond market rebellion in recent times. This could change if current levels of issuance at the state and territory level continue.

Retirement

What you need to know about retirement village contracts

Retirement village contracts often require significant upfront payments, with residents losing control over their money. While they may offer a '100% share in capital gain', it's important to look at the numbers before committing.

Sponsors

Alliances

© 2025 Morningstar, Inc. All rights reserved.

Disclaimer
The data, research and opinions provided here are for information purposes; are not an offer to buy or sell a security; and are not warranted to be correct, complete or accurate. Morningstar, its affiliates, and third-party content providers are not responsible for any investment decisions, damages or losses resulting from, or related to, the data and analyses or their use. To the extent any content is general advice, it has been prepared for clients of Morningstar Australasia Pty Ltd (ABN: 95 090 665 544, AFSL: 240892), without reference to your financial objectives, situation or needs. For more information refer to our Financial Services Guide. You should consider the advice in light of these matters and if applicable, the relevant Product Disclosure Statement before making any decision to invest. Past performance does not necessarily indicate a financial product’s future performance. To obtain advice tailored to your situation, contact a professional financial adviser. Articles are current as at date of publication.
This website contains information and opinions provided by third parties. Inclusion of this information does not necessarily represent Morningstar’s positions, strategies or opinions and should not be considered an endorsement by Morningstar.