As markets have become ever-more driven by an ever-narrower group of shares with ever-larger index weights and ever-higher valuations, the risk is biting. The pain has not been shared equally. While shares outside the US fell only 4% in January 2022, and lower-priced global ‘value’ shares by only 2%, the tech-heavy Nasdaq fell as much as 16%. There was an end-January bounce but markets are again sagging at time of writing in February.
More recently, the market has been concerned about inflation, rising rates and the threat of war between Russia and Ukraine. But many companies, particularly in the speculative parts of the market, were vulnerable before these recent concerns as a result of stretched valuations.
Valuations by revenue not profit
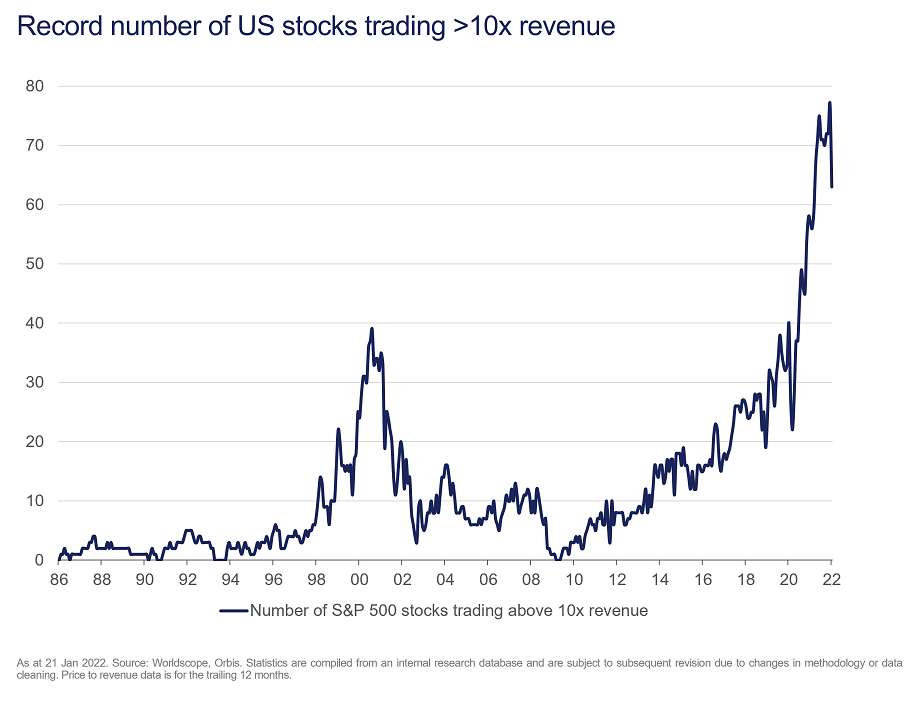
The valuations of speculative stocks may have fallen, but only from the exosphere to the stratosphere. At year-end, there were 77 companies in the US trading at over 10 times sales (that’s sales, not profits). That is, 10 times all the money coming in the door before any expenses, effectively pricing the companies as though they will grow to be the next Amazon or Microsoft. After January’s turmoil, there are roughly 60 companies still trading at those rich levels. That’s fewer than the end of 2021, but before 2020, the record was 39.

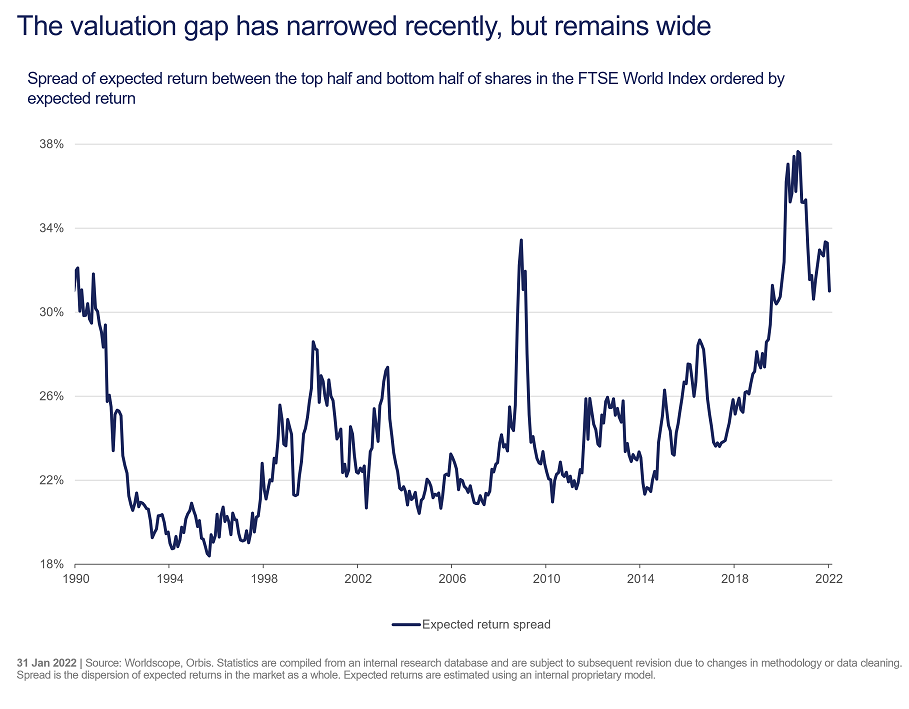
The good news is that the market momentum of the past few years has left lots of good companies trading at reasonable prices, and on nearly any metric, the valuation gap between lowly- and richly-priced shares remains vast.
In other words, January’s market moves have simply brought valuation spreads from the mind-blowing extremes of 2020 to the merely mind-boggling extremes of 2019. The following chart shows the difference in expected returns from what we consider ‘cheap’ stocks in the top half versus ‘expensive’ stocks in the bottom half of the FTSE World Index, using our internal proprietary model.

Of course, if the trends of the last decade persist, we know what to expect. Having briefly wobbled, fast-growing US technology companies will resume their dominance of stockmarkets, benefitting from a combination of low interest rates and scarce earnings growth.
But what if those trends don’t continue?
In the past two years, we saw a global pandemic that ground businesses to a halt, unprecedented transfers of money to individuals from government, limitless money printing from central banks, and the return of inflation high enough to frighten both central bankers and the markets that depend on them. When so much in the world has changed, it wouldn’t shock us if the drivers of markets did, too.
If they do, the future may look very different from both the pandemic and the years that preceded it, and the recent outperformance of less expensive shares may have a very long way to run.
While no two sell-offs are the same, it’s always useful to ask why the market is down. In recent years, stockmarkets have tended to drop due to some sort of economic crisis, such as the GFC in 2008, the Euro crisis in 2011, China’s currency devaluation in 2015, the oil and credit crash in 2016, fear of the Fed in 2018, and most recently the pandemic lockdowns. When the threat to markets comes from the economy, the companies most sensitive to the economy suffer most.
But stocks can also go down because they simply became too expensive. If expectations get too high, and would-be sellers can’t find ever-more-enthusiastic buyers, prices stall. If the market is down because overvalued stocks are getting less expensive, it is generally the most expensive stocks, not the most economically sensitive, that suffer most.
That could mean a lot more pain for richly-priced shares. In January 2022, the Nasdaq had its worst week since the initial Covid crash, falling 8% in five days. But in the aftermath of the tech bubble in 2000, the Nasdaq suffered 11 weeks worse than that in less than two years. Quick recoveries are not guaranteed.
In risky markets, what you don’t hold matters as much as what you do. In the Orbis Global Equity Fund, for example, our companies have similar growth characteristics to the average global stock, in aggregate, but trade at 16 times expected earnings, versus 23 times for the MSCI World Index. And with an active share above 90%, less than a tenth of the portfolio overlaps with the Index. That’s a very different portfolio of companies trading at much lower valuations.
In the long run, valuation always matters, so given the stretched backdrop and rapidly-changing sentiment, the shift within markets this month is in some ways unsurprising to us. But it is a very welcome un-surprise.
Shane Woldendorp, Investment Specialist, Orbis Investments, a sponsor of Firstlinks. This report contains general information only and not personal financial or investment advice. It does not take into account the specific investment objectives, financial situation or individual needs of any particular person.
For more articles and papers from Orbis, please click here.