The Encyclopaedia Britannica website explains that life expectancy is “an estimate of the average number of additional years that a person of a given age can expect to live.” The key word here is average, and there are different ways of calculating it.
How is life expectancy calculated?
There are two main calculation methods used: Period Life Expectancy and Cohort Life Expectancy. While these may sound technical, it’s important for everyone working in financial planning, superannuation, the media, etc, to know the difference.
1. Period life expectancy
Period Life Expectancy is the simpler method, and it’s the one typically quoted in the media and in legislation—however, it is highly misleading. Part of the reason it’s so commonly used is it’s easier to look up, and the life expectancies don’t change until the next Life Tables are produced.
Period Life Expectancy figures are just one part of the latest Australian Life Tables published by the Australian Government Actuary (AGA) every five years. The most recent life tables are based on the three calendar years centred on the 2016 census (the ‘period’).
The AGA looks at the total number of deaths in those three years, by age, as a percentage of the number of people who were alive at each age. This data informs a set of ‘mortality rates’ for the Australian population, which are the basis for life expectancy calculations.
Mortality rates give us the probability that a male or a female of any age passes away in the year before their next birthday. The probability an average 30-year-old passes away within a year is under 0.1%. But for older people, the probabilities increase markedly. The probability an average 90-year-old man dies within a year is around 15%.
By looking at the mortality rate at each and every future age of a person’s life, we’re able to calculate the probability they will survive to each future age. For a 60-year-old, we calculate the probability they will survive to age 61, then to age 62, then to age 63, and so on, all the way up to the end of the Australian Life Tables (age 109). This lets us calculate the average age they’ll live to based on all these probabilities.
Using the latest Australian Life Tables, a 60-year-old male’s Period Life Expectancy is 84.0; for a 60-year-old female, it is 86.9.
It is called their Period Life Expectancy because the mortality rates are based on a specific period, in this case, the calendar years 2015 to 2017.
2. Cohort life expectancy
In reality, because of ongoing medical developments and trends toward healthier lifestyles (e.g., a reduction in smoking), mortality rates have been decreasing steadily over the past decades, particularly since the 1970s. This means that life expectancy calculations based only on mortality rates from a specific period are simply wrong for most practical purposes.
Actuaries don’t ‘expect’ that the number of years a person will live in practice is their Period Life Expectancy. We’ve got to allow for these improvement trends. This is where Cohort Life Expectancy comes in.
Cohort Life Expectancy allows for the fact that mortality rates change during the lifespan of a group of people, or cohort, as they get older. Improvements in medical treatments and healthier lifestyles result in a reduction in their mortality rates from one period to the next.
Each time the Australian Life Tables are updated, the AGA carefully analyses how the mortality rate at each age has been changing by looking at data for up to the last 125 years. More recently, each set of Australian Life Tables comes with accompanying estimates of how mortality rates may change (improve) in the future. These assumptions are called improvement rate assumptions.
Cohort Life Expectancy calculations use this extra information. It means a significant improvement in accuracy. Instead of looking up mortality rates from, say, 2015, which effectively assumes each person spends their entire life in 2015, we acknowledge that people reach each birthday in a different future calendar year when mortality rates will have changed (reduced) relative to when the tables were produced.
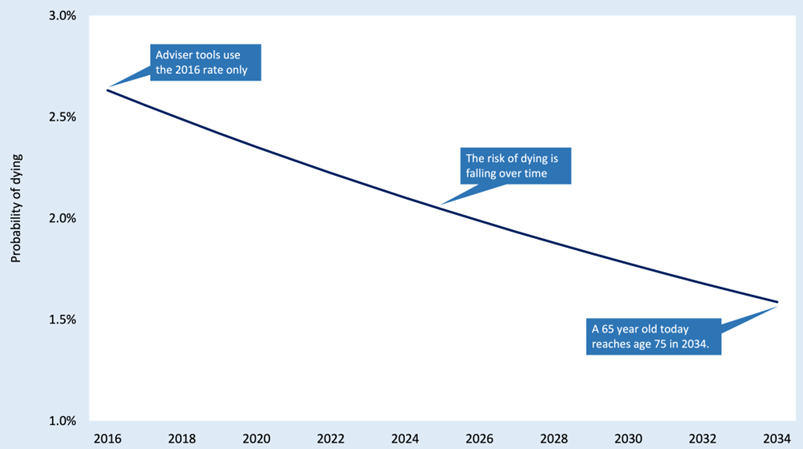
Chart 1 shows an example of how mortality rates change. It shows the estimated mortality rate at age 75 years over time. For a 65-year-old in 2024, by the time they reach age 75 (in 2034), the mortality rate for 75-year-old males would be nearly 40% less than when the tables were based 18 years ago.
Chart 1: Reducing mortality rate for a 75-year-old male
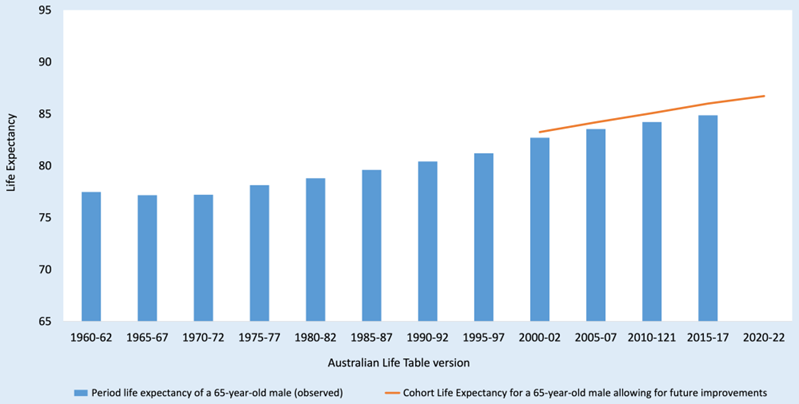
In Chart 2 below, each column shows the Period Life Expectancy for a 65-year-old male using the mortality rates from historic life tables (noting that today’s 65-year-olds were born in 1959).
The blue bars show strong, steady upward improvement. The red line shows their Cohort Life Expectancies, which are higher because the people’s assumed mortality rates will continue to reduce in the future.
Chart 2: Period and Cohort Life expectancy of a 65-year-old male
Using the latest Australian Life Tables with the 25-year improvement rate assumptions, the Cohort Life Expectancy of a 60-year-old male is 87.9—about four years more than his Period Life Expectancy. For a 60-year-old female, it’s 89.8—about three years more than her Period Life Expectancy.
Estimates are only that, however. Actual rates of improvement can vary from the estimates. Variation can occur if positive future medical advances are different to the estimates or if negative changes occur, such as increases in obesity, drug deaths, pandemics, etc.
At the end of this article, we show that the impact of COVID-19 on population mortality rates was less than many people might expect. The Australian Bureau of Statistics reports that total deaths in 2020 and 2021 were fewer than they anticipated prior to COVID-19, and that this is because public health measures also caused a reduction in deaths from several other causes. Since then, the total number of deaths increased but fell again in 2023. We therefore await the next Australian Life Tables at the end of the year. What is more important for longevity isn’t the mortality experience during a few years but over the long term.
Concluding comments or pearls of wisdom
Life expectancy is not a prediction of how long any individual will live—it’s just an average for a group or cohort at each age. None of us are average. We are all different, with different lifestyles, different genes, different attitudes to risk, and so on. This means the average is only relevant to a very small percentage of people.
Cohort Life Expectancies are a more realistic representation of the average number of years an individual or a group of people will live. However, as you can see, they are more complex to calculate and not as easy to simply look up in a table—as they depend on the year that you are doing the calculations.
No one should rely on Period Life Expectancy figures in practice, despite being easier to look up. They are only based on mortality rates that applied during a certain historic period. We know there are strong trends for these mortality rates to reduce in future years, resulting in higher life expectancies.
Don’t forget: Life expectancy calculations are based on the range of lifespans that can transpire for the individuals within a group. They are not a prediction. There is a large standard deviation around average life expectancy figures. For new retirees, the standard deviation is roughly eight years.
For financial planning, it’s vital to recognise that some people will have short lifespans, and others will have very long lifespans. What happens to each individual is subject to randomness. A more appropriate rule of thumb might be to focus on the age when most people in a group will have passed away.
David Orford is the Founder and Managing Director of, and Jim Hennington is Head of Innovation at Optimum Pensions. Optimum Pensions was launched in late 2017 with the objective of providing innovative sustainable retirement income solutions. This article is general information and does not consider the circumstances of any investor.