Much has been written about how tax breaks for superannuation will cost the Federal Budget $52.5 billion in 2022-23, almost equal to the money spent on the age pension. Treasurer Jim Chalmers used this to justify the proposed additional tax on super balances exceeding $3 million.
The tax breaks identified in Treasury's Tax Expenditures and Insights Statement (TEIS) included other big-ticket items such as capital gains tax main residence exemption, and rental deductions, which ran into the tens of billions of dollars.
But putting aside those items where it seems that not collecting more tax is actually a cost to the government, it was notable that franking credits appeared in the 212-page TEIS not as a 'tax expenditure', but as an 'aspect of the personal tax system'. Its presence being for 'distributional analysis' only.
Are franking credits back in play?
Which makes one wonder whether its ominous inclusion in the report places franking credits back in the gun when it comes to refundable franking credits. After all, the removal of franking credits refunded as cash was a centrepiece policy that the Labor Party took to the 2019 federal election, implying that it was a 'tax expenditure'.
Back in 2019, Labor claimed that removing cash refunds on franked dividends would save the budget $58 billion over a decade. They claimed that a $6 billion a year cost of refunding unused franked dividends was unsustainable. The $6 billion claim was based on Treasury analysis of refunded franking credits in the 2014/15 year.
That analysis revealed $47.5 billion of franking credits in total distributed by Australian companies in that year, of which $23.5 billion was eligible to offset tax liabilities. The remaining $24 billion was distributed to Australian companies and foreign investors, both unable to offset against Australian tax due.
The $23.5 billion eligible for tax offset was taken up by individual investors outside super funds, SMSFs, APRA-regulated and other super funds, and income tax-exempt entities. Surplus franking credits remaining after offsetting against tax are refunded. Refunded franking credits totalled $5.9 billion in 2014/15. Distribution of the $23.5 billion franking credits by entity and utilisation (tax offsets and refunds) are as follows:

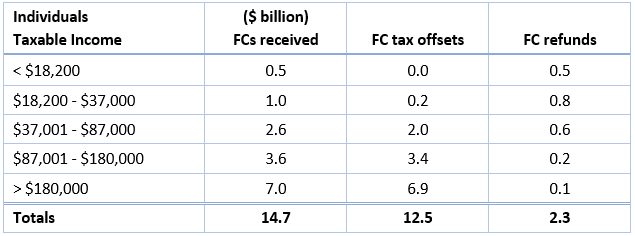
Further analysis of the 2014/15 data revealed for individuals receiving franking credits:

Note, as expected, all franking credits received by individuals were refunded in the tax-free threshold group, with 80% refunded in the next bracket. But perhaps surprisingly, there is some small refundability in the higher tax brackets. That is due in the main to individuals deriving income from foreign sources and receiving foreign income tax offsets reducing their tax liability to less than franking credits received.
The distributional franking credit analysis in the TEIS refers to the 2019/20 tax year.
In summary, $67.0 billion of franking credits were distributed, of which $28.1 billion was eligible to offset tax liabilities. The remaining $38.9 billion was distributed to Australian companies and foreign investors.
Further analysis of ATO data reveals the distribution of the $28.1 billion franking credits by entity and utilisation (tax offsets and refunds) for 2019/20:

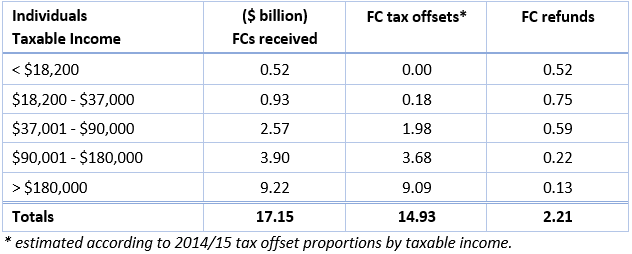
And the corresponding analysis for individuals by taxable income bracket in 2019/20:

Tax offset/refund splits were not available for the individuals cohort. This was estimated according to the 2014/15 offset proportions by tax bracket, which would appear to be valid given the distribution of taxable income for those in receipt of foreign income tax offsets was similar for 2014/15 and 2019/20.
Some observations
- Refundable franking credits grew from $5.9 billion in 2014/15 to $6.4 billion in 2019/20.
- APRA-regulated and other super funds receive a far smaller proportion of franking credit refunds compared to SMSFs, because of a higher proportion of member contribution tax to offset against.
- The proportion of SMSF tax offsetting franking credits has increased from 30% at 2014/15 to 40% in 2019/20, probably a result of the introduction of the Transfer Balance Cap in 2017/18, such that tax-free investment earnings have fallen as a percentage of total investment earnings, leaving more tax to offset against. It was estimated that approximately two-thirds of the SMSF refunds in 2014/15 was due to tax-free super.
- The anticipated growth in SMSF franking credit refunds following the introduction of tax-exempt pension phase earnings in 2007/08, has stalled and indeed retreated with refunds falling from $2.6 billion in 2014/15 to $1.9 billion in 2019/20.
- Meanwhile tax-exempt entity refunds grew from $0.7 billion to $2.1 billion, noting that the federal government’s own Future Fund is exempt from income taxation, and received just over half of the 2019/20 tax-exempt entity refunds at $1.2 billon.
- Remove the increase in tax-exempt entity refunds and total refunds in 2019/20 would have fallen $0.9 billion from 2014/15, to $5 billion.
Despite the fact that returning unused franking credits to investors is an entirely fair system, no doubt there are those who consider the 2019/20 refunds totalling $6.4 billion as revenue forgone. But those same people do not take into account the top-up tax paid on franked dividends by those individuals on marginal tax rates higher than the corporate tax rate. Because when corporate profit is distributed as dividends, it effectively becomes individual income for tax purposes.
For example, someone on a marginal tax rate of 45% who receives a $70 dividend, must pay $45 tax on the $100 gross dividend ($70 + $30 franking credit). The franking credit offsets $30 of that tax liability, to which they add an extra (45% - 30%) x ($30 / 0.3) = $15 in top-up tax.
Applying the same maths to the franking credit offsets by tax bracket in the last table above, yields total top-up tax paid by individuals in 2019/20 of $5.6 billon. Which makes it hard to argue that the system is one of revenue leakage. And why the inclusion of franking credits in the TEIS for distributional analysis only, should remain just that.
Tony Dillon is a freelance writer and former actuary. This article is general information and does not consider the circumstances of any investor.