Register For Our Mailing List

Register to receive our free weekly newsletter including editorials.

Home / 577

Australia's house price league table

The housing value league tables have evolved significantly over recent years. At the onset of COVID in March 2020, Sydney had the highest median dwelling value, followed by Melbourne, the ACT and Brisbane. Perth was ranked 7th in terms of median dwelling value, after Darwin with the lowest median, followed by Adelaide.
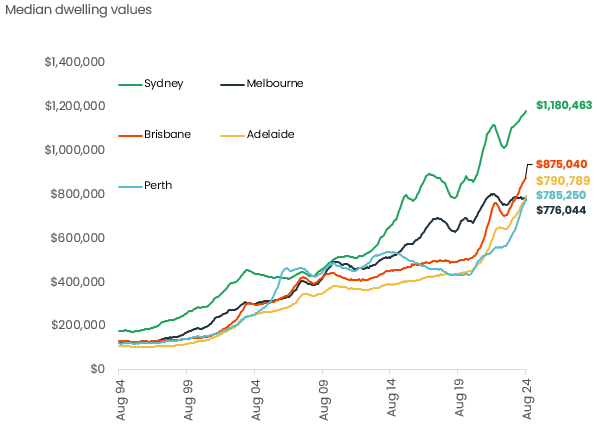
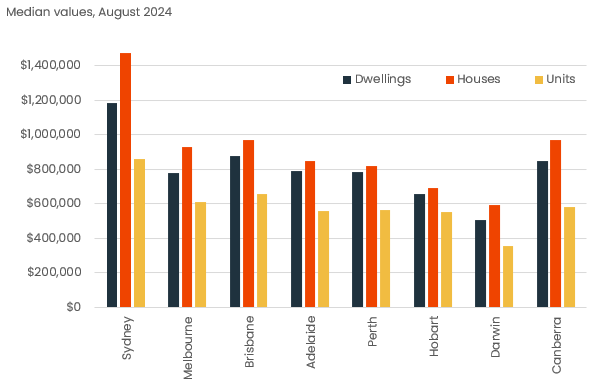
Fast forward to August 2024, and Melbourne’s median dwelling value, at $776k is ranked sixth lowest across the eight capital cities, after Darwin ($504k) and Hobart ($655k). The difference between Sydney and Melbourne’s median dwelling value is now 52.1%, the largest differential between Australia’s two largest capitals since June 1999.
Sydney continues to record the most expensive median dwelling value at $1.18 million, but the gap between Sydney and the mid-sized capitals has narrowed substantially. Sydney’s median is ‘only’ 35% higher than Brisbane’s, the narrowest difference since July 2013, the 49% premium over Adelaide’s median is the narrowest since May 2013 and the 50.3% premium of Perth’s median hasn’t been this narrow since June 2015.
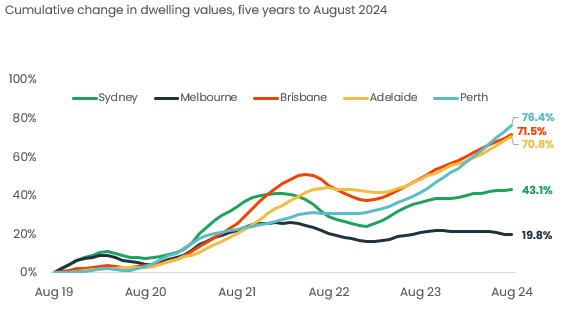
The changing hierarchy of housing values across Australia’s capital cities is attributable to both the speed of change in home values as well as the composition of housing.

Speed of change

The past five years has seen national dwelling values rise by 47.9%, but with extreme diversity from city to city. Perth has led the pace of gains with a stunning 76.4% rise in values since August 2019, Brisbane values are up 71.5% and Adelaide has surged by 70.8%. At the other end of the spectrum is Melbourne where values are up ‘only’ 19.8% and Sydney values have risen by 43.1%.

Such a rapid pace of growth in housing values across the mid-sized capitals has been a key factor driving the shift in median dwelling value rankings.

The past 12 months has seen a continuation in this diversity of housing conditions, with the 25.6 percentage point range in annual growth rates across the capital cities now the widest since the height of the mining boom in 2006.

There are a few factors that have contributed to different speeds of change across the capital cities since the start of the pandemic, including;

Demographic patterns: marked differences in net interstate migration trends, where strict, extended social distancing restrictions were a ‘push’ factor from Melbourne, while Brisbane, Perth and Adelaide likely benefitted from Melbourne departures. SA and WA saw net interstate migration trends move into positive territory through the pandemic for the first time in many years. The latest internal migration data to the end of 2023 showed net interstate migration to Victoria was still in negative territory, albeit mildly, while NSW, TAS, NT and ACT were all fairly negative.

New housing supply is another aspect driving divergence in the growth trend, with Victoria seeing far more dwelling completions than any other state or territory in the past decade, and ACT seeing an ongoing trend of elevated unit completions.

Housing affordability was far less stretched across the mid-sized capitals leading into the pandemic due to a prolonged period where values didn’t rise any where near as much as Sydney and Melbourne over the previous growth cycle.

Composition of housing. A key factor in the median dwelling value of Perth and Adelaide overtaking Melbourne is the underlying mix of housing types. The median dwelling value measures the 50th percentile valuation estimate of all houses and units combined.

Importantly, when we measure the median house and unit value separately, Melbourne is still showing a higher median across both housing types than Perth and Adelaide.

The difference comes back to the composition of dwellings and the fact that Melbourne has densified more substantially and rapidly than the mid-sized capitals. In August, CoreLogic estimates a third (33%) of housing stock in Melbourne falls within the multi-unit sector, compared with 25% in Brisbane and 16% of housing stock in Adelaide and Perth.
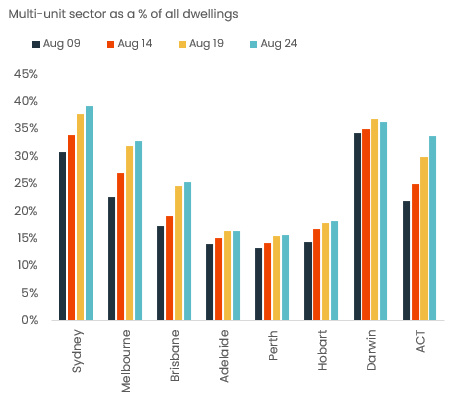
Considering unit values are generally much lower than house values, the higher portion of multi-unit dwellings in Melbourne tends to weigh the median dwelling value down relative to cities with a skew towards lower density styles of housing.

There hasn’t been much progress in densification across Perth or Adelaide. Over the past fifteen years, the composition of Perth dwellings moved from 13% within the multi-unit sector to 16%. Similarly, Adelaide moved from 14% to 16%. Over the same time frame, Melbourne’s multi-unit sector has increased from 23% of all housing to 33% and Sydney has increased from 31% to 39%.

Hobart, where 18% of dwellings fall within the multi-unit sector, and Darwin (36% multi-unit) have a larger portion of medium to high density dwellings than Perth and Adelaide.

The compositional difference in housing types between the capitals is a clear factor influencing the median dwelling value as well as measures of housing affordability.

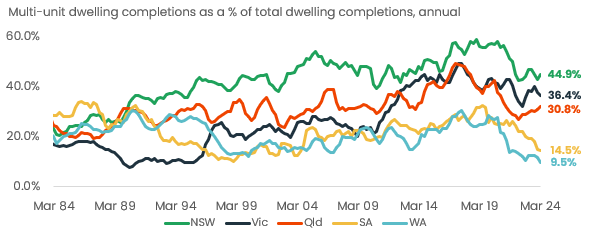
Annual dwelling completions data shows this trend perpetuating, with the multi-unit sector across WA and SA comprising just 9.5% and 14.5% of all dwelling completions over the 12 months to March 2024, less than half the national average of 33.8% and well below the portion of multi-unit sector completions across every other capital city.

As affordability becomes more stretched and state governments shy away from the expense associated with sprawling infrastructure commitments required to maintain a geographically distributed population, we are likely to see some renewed focus on establishing higher densities in Perth and Adelaide.
 

Tim Lawless is Executive, Research Director Asia Pacific at CoreLogic. This article is general information and does not consider the circumstances of any investor.


5 Comments
Trevor
September 13, 2024

I couldn’t agree more. Land tax in NSW is set to rise too with the labor government freezing the threshold.

Trevor
September 13, 2024

This was in response to Geoff R

Peter Taylor
September 12, 2024

Multi unit housing increasing in our bigger capital cities as we transition from home owners to renters. The goverments big australia agenda does not mean everyone will be winners.

No issues yet with affordability as the goverment has high levels of immigrants arriving who can afford to buy houses. The issue is more buyers than houses available so this should keep prices rising. More voters are comfortable with rising house prices with 60% of homes owner occupied so only lip service needed for those who can't afford to buy and are sucking it up without protest.

John Corbin
September 12, 2024

Interesting, especially viz a viz Melbourne growth 19.8 % vs the rest....significantly below the other capitals. A number of clearly relevant reasons are given for this. Personally though, I would like to see it further teased out into % property rentals in each individual market. Is a lack of investment in rental properties having an effect as well on price movements in Melbourne. The Victorian government is in my view trashing the rental market with additional taxes and regulations that operate against ownership of investment properties vs the other States and I wonder if this is having an effect on housing prices due to reduced buying pressures in the market.

Geoff R
September 13, 2024

>"The Victorian government is in my view trashing the rental market with additional taxes and regulations that operate against ownership of investment properties"

This certainly seems to be the case. Victoria has enormous debt and so land tax has increased greatly recently and you could be forgiven for mistakenly thinking it was actually the Greens in power given the changes in favour of tenants and the added compliance costs.

There is no simply way today I would recommend anyone buy an investment property. Stamp duty was abolished on share transactions decades ago but you still pay it on houses. And brokerage on shares is generally small with a discount broker compared to a real estate agent. And with shares you get your money a couple of (business) days after you decide to sell. And you can easily sell a small portion of your holding. And you don't pay land tax. And you don't have to worry about tenants trashing your investment. And you can diversify with a number of holdings or use an ETF or LIC rather than having a large chunk of your assets in one place. And so on and on almost ad infinitum.


Leave a Comment:

RELATED ARTICLES

The net benefit of living in Australia’s cities has fallen dramatically

Why has nothing worked to fix Australia's housing mess?

House price doomsayers: Could housing prices really fall by 20%?

banner

Most viewed in recent weeks

Vale Graham Hand

It’s with heavy hearts that we announce Firstlinks’ co-founder and former Managing Editor, Graham Hand, has died aged 66. Graham was a legendary figure in the finance industry and here are three tributes to him.

Australian stocks will crush housing over the next decade, one year on

Last year, I wrote an article suggesting returns from ASX stocks would trample those from housing over the next decade. One year later, this is an update on how that forecast is going and what's changed since.

Avoiding wealth transfer pitfalls

Australia is in the early throes of an intergenerational wealth transfer worth an estimated $3.5 trillion. Here's a case study highlighting some of the challenges with transferring wealth between generations.

Taxpayers betrayed by Future Fund debacle

The Future Fund's original purpose was to meet the unfunded liabilities of Commonwealth defined benefit schemes. These liabilities have ballooned to an estimated $290 billion and taxpayers continue to be treated like fools.

Australia’s shameful super gap

ASFA provides a key guide for how much you will need to live on in retirement. Unfortunately it has many deficiencies, and the averages don't tell the full story of the growing gender superannuation gap.

Looking beyond banks for dividend income

The Big Four banks have had an extraordinary run and it’s left income investors with a conundrum: to stick with them even though they now offer relatively low dividend yields and limited growth prospects or to look elsewhere.

Latest Updates

Investment strategies

9 lessons from 2024

Key lessons include expensive stocks can always get more expensive, Bitcoin is our tulip mania, follow the smart money, the young are coming with pitchforks on housing, and the importance of staying invested.

Investment strategies

Time to announce the X-factor for 2024

What is the X-factor - the largely unexpected influence that wasn’t thought about when the year began but came from left field to have powerful effects on investment returns - for 2024? It's time to select the winner.

Shares

Australian shares struggle as 2020s reach halfway point

It’s halfway through the 2020s decade and time to get a scorecheck on the Australian stock market. The picture isn't pretty as Aussie shares are having a below-average decade so far, though history shows that all is not lost.

Shares

Is FOMO overruling investment basics?

Four years ago, we introduced our 'bubbles' chart to show how the market had become concentrated in one type of stock and one view of the future. This looks at what, if anything, has changed, and what it means for investors.

Shares

Is Medibank Private a bargain?

Regulatory tensions have weighed on Medibank's share price though it's unlikely that the government will step in and prop up private hospitals. This creates an opportunity to invest in Australia’s largest health insurer.

Shares

Negative correlations, positive allocations

A nascent theme today is that the inverse correlation between bonds and stocks has returned as inflation and economic growth moderate. This broadens the potential for risk-adjusted returns in multi-asset portfolios.

Retirement

The secret to a good retirement

An Australian anthropologist studying Japanese seniors has come to a counter-intuitive conclusion to what makes for a great retirement: she suggests the seeds may be found in how we approach our working years.

Sponsors

Alliances

© 2024 Morningstar, Inc. All rights reserved.

Disclaimer
The data, research and opinions provided here are for information purposes; are not an offer to buy or sell a security; and are not warranted to be correct, complete or accurate. Morningstar, its affiliates, and third-party content providers are not responsible for any investment decisions, damages or losses resulting from, or related to, the data and analyses or their use. To the extent any content is general advice, it has been prepared for clients of Morningstar Australasia Pty Ltd (ABN: 95 090 665 544, AFSL: 240892), without reference to your financial objectives, situation or needs. For more information refer to our Financial Services Guide. You should consider the advice in light of these matters and if applicable, the relevant Product Disclosure Statement before making any decision to invest. Past performance does not necessarily indicate a financial product’s future performance. To obtain advice tailored to your situation, contact a professional financial adviser. Articles are current as at date of publication.
This website contains information and opinions provided by third parties. Inclusion of this information does not necessarily represent Morningstar’s positions, strategies or opinions and should not be considered an endorsement by Morningstar.