For the past 30 years, global fixed income investors have enjoyed an almost unbroken run of positive absolute returns.
Diversified global fixed income has not only done its job of providing protection and diversification but has formed the basis of strong overall portfolio performance, particularly on a risk-adjusted basis. It has been a truly golden period where a relatively static strategy has been highly rewarding. Yet Australians remain significantly under allocated to bonds.
Are bond markets at a turning point?
Recently, more commentators have called an end to this secular bull market. Indeed, in the past few years we have experienced several periods of rising bond yields. In particular, since July 2016 when China unveiled a package of stimulus measures, it signalled a reflationary environment could bring an end to this virtuous bond environment.
Whether this transition is - ideally - slow and gradual, or swift and violent, is still to be seen, but in our view, we are likely to see a change of scenery from the near cyclical lows in yields.
With benchmark duration expanding, creating greater sensitivity to interest rates moves, future traditional fixed income returns appear mediocre at best. At worst, index-constrained investors may end up nursing capital losses as low coupons may not cushion potential price drops.
(Duration measures a bond's price sensitivity to changes in interest rates. For example, if a bond has a duration of five years, its price will fall about 5% if its yield rises by 1%).
The fallacy of benchmarks
The current construction of the high-profile Bloomberg Barclays Global Aggregate Index highlights the risks that investors may be exposing themselves to, leading to the potential for ‘rewardless risk’ over the near to medium term.
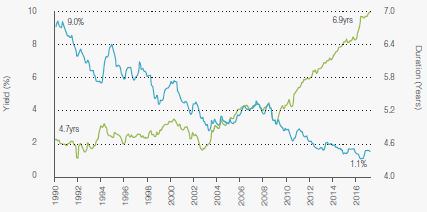
The rapid rise in the duration of this Index - as shown in the chart below - increases both the sensitivity of the index to future rises in rates and the likelihood of capital erosion.
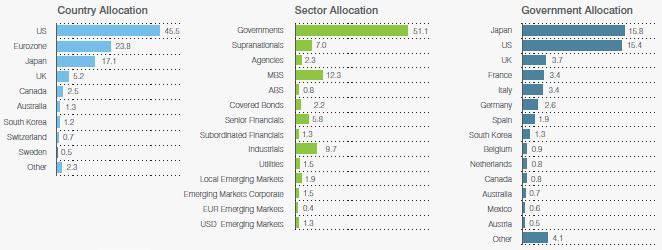
In addition, the Index currently includes approximately 18,000 issues that span 70 countries and 24 currencies. It is a monster, making it difficult to efficiently replicate, incurring higher transaction costs and greater error in the tracking process. It doesn’t necessarily provide the diversification that investors expect. For example, it is heavily biased to countries that have been issuing the most debt; the US, Eurozone and Japan via sovereign bonds, which make up more than half of the Index.
What of return expectations? At 30 June 2017, this Index offered a yield of 1.63%, offering little protection against the shocks that could lie ahead. About 15% of the underlying securities are paying a negative yield, eating capital in the process. An additional 22% of bonds pay less than 1%. While some investors are tightly mandated to hold allocations close to the Index, those with the ability to make a choice are already on the move.
Figure 1: Bloomberg Barclays Global Aggregate Index Rate and Duration History

Source: Bloomberg Barclays Global Aggregate Index
Flexibility and innovation are critical
With this backdrop, it is not overly dramatic to say that fixed income investing is going through a sea change. From discussions with investors, there is a far broader agenda on the table with increased scrutiny and deeper thinking around how best to structure exposure in the next market phase. Asset management industry innovation has witnessed the development of niche strategies designed to exploit structural alpha sources through to broadly-based unconstrained approaches that ignore the benchmark in the search for the optimum balance between risk and return.
New approaches and new strategies are the order of the day. However, it is not straightforward as investors fret over how to construct portfolios if core fixed income offers less protection and, potentially, becomes more correlated to traditional growth assets. Indeed, the lines blur further due to the growth of alternative fixed income strategies that are aggressive in their approach, utilising shorting techniques alongside complex trading and derivative strategies.
Finding value in the interconnected bond markets
If the Index is the ‘rewardless risk’ trade, where is the value in bonds? The chart below shows global bond markets are dominated by a few countries, sectors and investors.
Figure 2: Big universe, limited selection

Source: Bloomberg Barclays Global Aggregate Index
Regardless of the direction of rates, the interconnectedness of global markets and the overpowering presence of central banks fuel dislocations and opportunity, created by:
- Fear and greed
- Supply and demand, including non-economic players such as central banks, and
- Lack of long-term investment horizons.
Due to any combination of these factors, prices can deviate significantly from fundamental fair value, but over time prices typically adjust to reflect inflation, credit fundamentals and liquidity conditions.
Alongside these dislocations sit the economic opportunities that arise as the outlook for growth, inflation and liquidity conditions change. These are impacted by longer term drivers such as indebtedness, demographics and technological change.
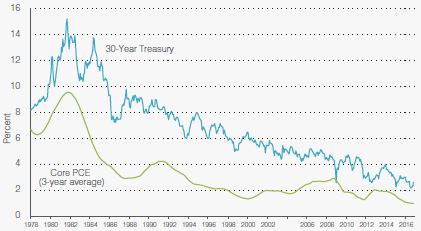
Let’s look at one of these dislocations, assuming the history of interest rates is the history of inflation, as seen in the Figure 3.
Figure 3: The history of US rates is the history of inflation

Source: Bloomberg. As of 31 March 2017. PCE = Personal Consumption Expenditures, is an inflation index excluding food and energy.
One could be forgiven for thinking that the fast-growing emerging markets have a higher inflation pace than the traditionally slower developed markets. But this is not the case, as emerging and developed market inflation rates are actually converging.
This is an example of where value can be found.
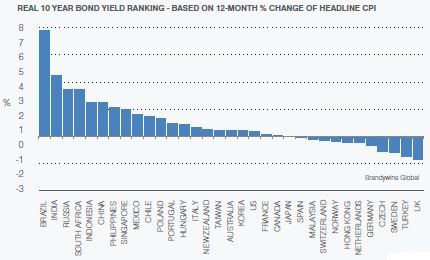
As the chart below shows, the real yields offered in emerging markets such as Brazil, South Africa, Indonesia and Mexico are attractive at current levels, given the drop in inflation in those countries. This contrasts dramatically with the European developed market stalwarts of the UK and Germany, whose real yields are negative.
Figure 4: Where is the value?

As of 31 May 2017.
The largest and most important market - US sovereigns - appears to be fairly valued on this analysis and here the debate is most pronounced around the value of the US dollar. A strong argument would be that the greenback is overvalued, measured on a purchasing price parity (PPP) basis, and President Trump would certainly like to see it lower. This trend of a weakening US dollar has been evident since his election in late 2016.
What’s next in the ‘normalisation’ of bonds?
Much is written about normalisation of markets, but - what is normal? Is the post Second World War period any guide at all, or is normal more similar to the nineteenth century when bonds offered low stable yields for multiple decades? How will the great QE experiment end and what tantrums and turmoil might we seeing going forward? And, how does the geo-political flux impact returns and expectations?
As ever in the investing world, asking questions is much easier than finding the answers. The bond market has evolved and developed a range of strategies, instruments and approaches that can be applied to navigate a more complex world. It is this complexity that should drive more investors away from poorly-constructed benchmarks, freeing them to embrace the flexibility and improved return and diversification potential of a more unconstrained or even absolute return approach.
Andy Sowerby is Managing Director at Legg Mason Australia. This article is general information and does not consider the circumstances of any investor.