There’s always consistent noise on the macro-economic environment at any stage of the investment cycle. Currently, negative interest rates, volatility and international political affairs such as Brexit and the US-China trade war are the main talking points.
These macro-economic issues do impact market sentiment, especially in the short term, and investors often believe they need to come to grips with them in order to make the right investment decisions.
Structural growth more important than macro trends
While being cognisant of the prevailing market, at Munro Partners, we take a longer-term view. The macro picture isn’t the key to investment success. Instead, it is structural growth that will deliver the strongest returns over the long term, regardless of the economic backdrop or point in the cycle.
As a growth manager, we are looking for structural growth opportunities and identifying and investing in the winning stocks. Earnings growth drives stock prices, sustained earnings growth is worth more than cyclical earnings growth and markets will often misprice growth and its sustainability.
Another way of describing this is the ability to identify S-curves.
In business terms, the S-curve tracks how a company or industry grows over its lifecycle. There comes a point in the lifecycle when growth inflects, driven by a structural change. It is the tailwind created by the structural change that assists a company to deliver and create wealth. The resulting graph looks like an elongated 'S'.
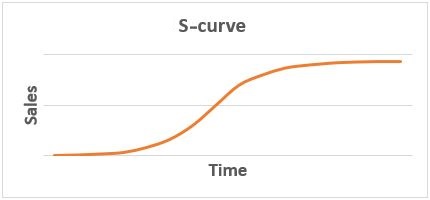
Looking at the S-curve can help investors work out where a company or industry is on its structural transition, or growth trajectory.
Examples using the S-curve
Digital payments is a good example, and one that most people can relate to. In Australia, many people have gone from using cash 100% of the time to approximately 30% in their day-to-day transactions, and instead using cards or mobile phones to 'tap and go'.
Translating this to an S-curve, it means that people started using cards, just occasionally at first and then, as cards got easier, they started using them a lot more.
The network effect is evident: more people making digital payments, leading to more merchants offering digital payments, leading to easier to use digital payment technology, leading to more people making digital payments – and so on. This is how the S-curve first kicks up and continues at an increasing pace.
According to Visa, penetration in Australia is the second highest in the world for tap-and-go payments (after Sweden). Around 90% of face-to-face transactions here are now tap-and-go, and that’s happened in the space of about four or five years. So Australia is at the top of the S-curve, where growth is tapering off.
However, looking globally, the opportunity is still significant. The US, for example, is currently below 10% for tap-and-go payments. Meanwhile, the global average is around 50%. Looking at all the main providers (Visa, Mastercard, PayPal etc), we would estimate that they are approximately 40% through their S-curve, and future growth is still sizable.
Of course, the S-curve trajectory does run out. Smartphones are an example of this.
A decade ago, smartphone penetration was virtually non-existent, and the mobile phone market was dominated by names such as Blackberry, Motorola, Eriksson and Nokia.
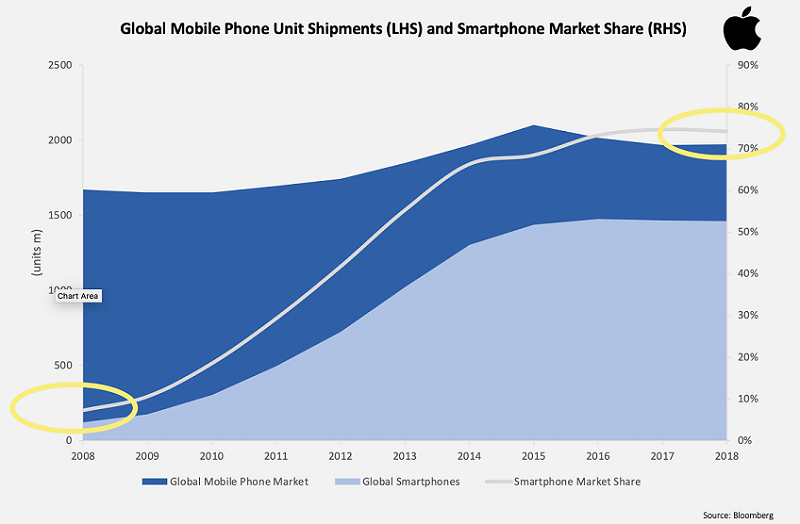
Today, over 80% of people with a mobile phone, have a smartphone, and the clear majority of these in developed nations are either Apple or Samsung. Blackberry and its ilk have all but disappeared from the mobile phone market.
However, the smartphone market has now stopped growing. Apple is currently relying on price hikes and its services revenue for growth, not new customers for its products.
We seek to work out the size of the market, the size of the structural opportunity, and where we are in that structural opportunity i.e. are we at the start, the middle or the end of the S-curve?
We would argue that the S-curve always beats the macro when it comes to investing.
Opportunities for investors
One industry that exhibits the beginning of the S-curve is cloud computing and the shift to software as a service.
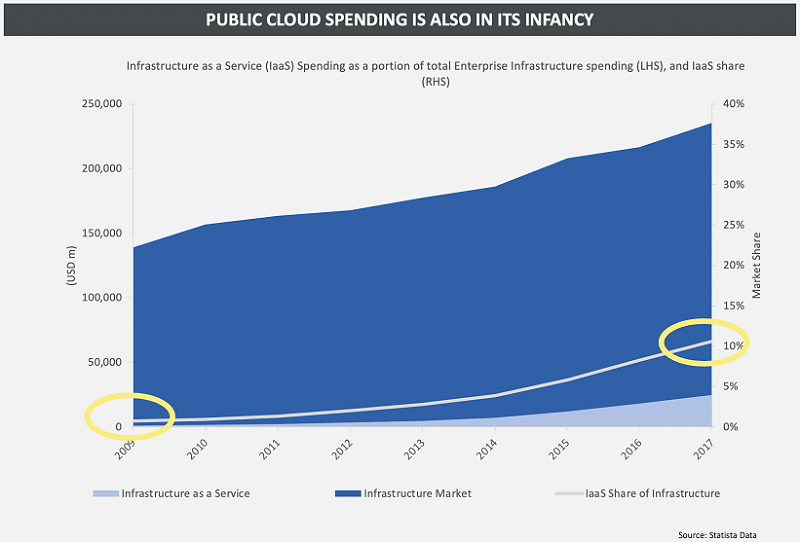
We see this as a great opportunity. Globally, IT spending grows at around 1-3% per annum, split into software, hardware, IT services and data centres, as the four main components.
But the spend on IT has changed dramatically in recent years.
Businesses don’t need to buy a server anymore, because they can host all their information and data in the cloud. They don’t need to buy IT support anymore because they’re buying software as a service through the cloud. And they don’t need to spend as much on hardware because they don’t need as much equipment. It’s almost possible to run a business off a smartphone.
While big companies like Microsoft and Amazon have been significant beneficiaries of this trend, we believe there is also scope for smaller high growth software companies to come along and dominate their areas. As a few examples – Adobe dominates the media suite area; Salesforce does CRM; and Atlassian is the go-to provider for developers.
These companies are creating their own network effects globally, just as we saw previously with Google or Facebook.
Their stocks are highly valued but we believe they are still not valued correctly because of the network effect and cash generation capacity as they go through this structural shift.
Picking the trend
Investors also need to ensure they understand the difference between picking the trend and picking the winner.
There’s nothing worse than getting the structural trend right but picking the wrong stock. For example, identifying the potential for Android phones but investing in HTC 10 years ago instead of Samsung.
Another good example is streaming TV. The thesis is that streaming TV will replace linear TV over a period of time, and most people would probably agree with this. So we are on the S-curve of streaming adoption.
However, many people are talking about who will be the winner in the space and whether Netflix will continue its success story. But the loser here is not Netflix vs Disney vs Amazon. The loser is linear TV channels, all around the world. Many of them will cease to exist in the next decade, if the thesis is correct. And the winners are the companies that provide quality streaming services.
Not every company will succeed, but the key to success is being able to identify the few winners that will succeed from the structural growth tailwinds, regardless of the macro-environment.
Nick Griffin is a Founding Partner and Chief Investment Officer of Munro Partners. This article is for information purposes only and does not consider the circumstances of any investor.