Register For Our Mailing List

Register to receive our free weekly newsletter including editorials.

Home / 74

Stock market winners versus losers

There is no one single magic formula for successful stock picking. Here at Cuffelinks we have seen articles espousing many different ways of picking stocks, notable examples being to focus on value and quality. These ideas all have merit. In this article, I work through one example: the phenomena that winning stocks continue to outperform losing stocks, known as ‘the perseverance of winners versus losers’. It sounds rather novel, simple and surely too good to be true …

The theory

In 1993 academics Narasimhan Jegadeesh and Sheridan Titman wrote what has become a well-known paper titled, “Returns to buying winners and selling losers: implications for stock market efficiency”. They found in the US stock market that buying the top performing stocks from the previous period (3 to 12 months) and selling short the bottom performing stocks from the same period resulted in significant outperformance over a holding period of 3 to 12 months.

For the academic world this caused a lot of kerfuffle as it threw a spanner in the works of those who proclaim that markets are perfectly efficient: how could such a simple look-back strategy perform so well?

Subsequent research demonstrated that the effect has worked internationally, and recent research suggests it continues to work today. Researchers have attempted to explain the perseverance of winners versus losers, some as a reward for taking on some risk loading and others as a behavioural phenomenon. The behavioural arguments sit better with me.

Applying winners versus losers to Australia

Does the strategy work in Australia? Cuffelinks isn't really the forum for academic research tests of such detail, so I produce a simplified analysis. For each of the last 10 financial years I run the following analysis:

  • At the start of each financial year I go long an equally-weighted portfolio of the previous financial year’s top 10 performing stocks on the ASX 200
  • I also short an equally weighted portfolio of the previous financial year’s worst 10 performing stocks on the ASX 200
  • I hold this portfolio for the subsequent financial year (ie a 12 month holding period).

As an example, the table below lists stocks I would have held during the previous financial year (2013/2014), along with subsequent performance.
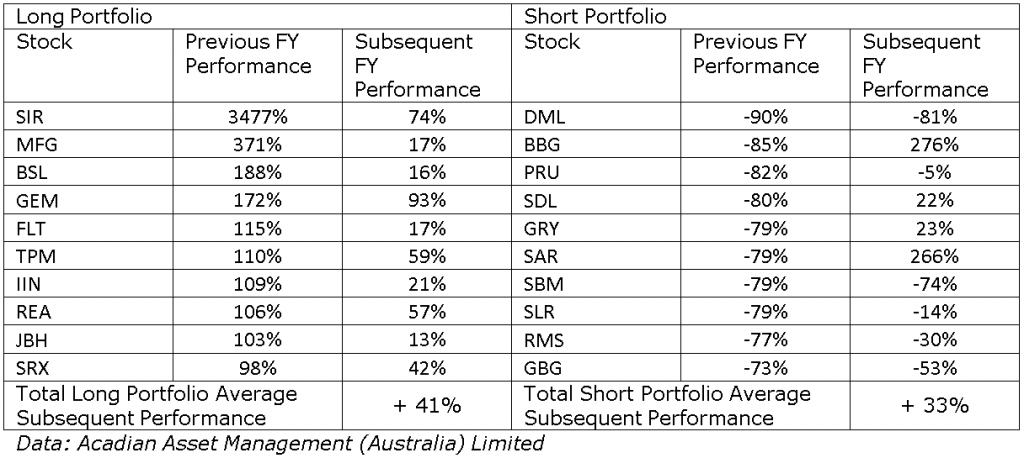
Using the table above if I subtract my short performance (+33%) from my long performance (+41%) I end up with a total performance of 8%.

The last financial year has been one of the least impressive for this strategy but is still positive; looking back this quite simple strategy looks to have been highly successful. The charts below present the 10 year track record.
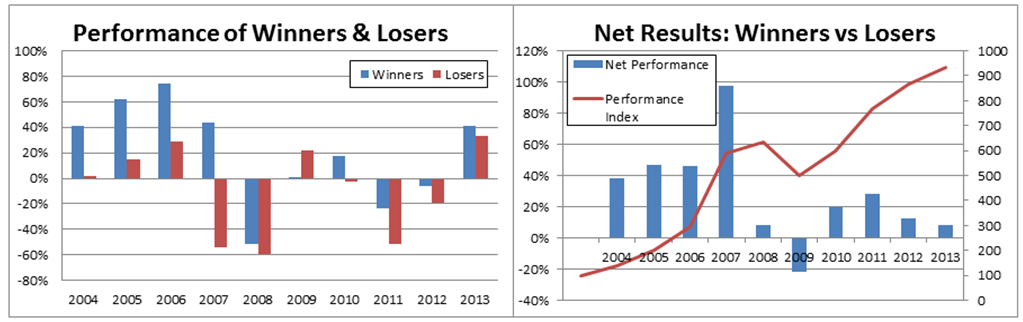
The left chart displays the subsequent performance for both winner and loser portfolios, while the right chart shows the annual net returns from going long winners and short losers, along with an index of compounded performance (starting at value 100). Positive performance is seen in those years that the winners on average outperform the losers, which is seen in all except one year. In 2007 the winners perform very strongly over the subsequent 12 months, and the losers continue to underperform leading to a very strong net result. However in 2009, the winners only marginally outperform, whereas the shorts hurt net performance with the rally in previous loser names as the market turned strongly positive in March 2009.

This strategy appears to have surprisingly good performance. The annualised performance would have been 25%, but the results are highly volatile (the standard deviation of annual returns was 32%). And though a rather naïve strategy, the results appear significant (see this Cuffelinks article for an explanation of a significant result). The strategy has no inherent market exposure as you are taking equal sized positions long and short. In fact you would earn some additional cash deposit returns in your portfolio (I won’t bog you down with an explanation of why).

To be honest, ‘strategy’ is too generous a word to describe this simple analysis. It shows no concern for sector exposures nor does it re-balance stock positions or net market exposures throughout the year. There are also some practical limitations to implementing such a strategy. The main one is shorting, as it may prove difficult to achieve a short position in each loser stock. Someone needs to be happy to lend out their stock, thereby adding to the downward momentum in the stock price.

Nonetheless the strategy is interesting and can be used in benchmarked funds as well, where losers may not be held in the fund giving a benchmark underweight without requiring shorting. The winners versus losers phenomenon forms the basis on which the momentum signal, used by many global quantitative equity managers, is built.

Behavioural explanations

There are many explanations proposed for the perseverance of stock market winners versus losers. One explanation was the possibility of uninformed traders who simply follow the trend in prices. Another example suggests that investors switch from underperforming to outperforming funds and this creates a flow of capital that creates momentum. It is likely that there are many reasons that contribute to explaining the momentum phenomenon.

Takeout messages

Of course I am not recommending you go out and replicate this ‘strategy’ – I wouldn't myself. The point of my article is to illustrate that there are many different ways to pick stocks. Some are based on company analysis, some are technical, and some are behavioural. You need to pick out the approaches that you believe you can execute well and understand the strengths and weaknesses of your approach and the environments in which it will work and in which it may struggle.


David Bell is Chief Investment Officer at AUSCOAL Super. He is also working towards a PhD at University of NSW.


  •   8 August 2014
  • 3
  •      
  •   
3 Comments
Hugh Dive
August 08, 2014

Interesting piece David. Is one of the reasons why this momentum-based strategy has worked over the past 10 years is that few institutional fund managers could handle the volatility and the feedback from asset consultants of this strategy ?

David Bell
August 08, 2014

Hi Hugh, momentum is a strange phenomenon. I would stay away from a stock strategy that only looks at a single factor like this. It would not surprise me to see positive performance going back much further than the last 10 years - the original date of the research goes back 20 years. I suspect all asset consultants would take a similar view! More refined momentum signals are used by many quant managers around the world and even some discretionary managers. This makes more sense to me.

I agree that as presented the strategy is far from implementable - my 'analysis' was more to add some colour to the history lesson!

However there is also a bigger debate around the dangers that momentum investing has on market efficiency and price discovery. Jack Gray and Ron Bird for instance have done some interesting research on this and I think many of their views are worth reflecting on.

Cheers, David

Rob Stewart
September 12, 2014

Hi David

Interesting article. There has been a mountain of work done on momentum such as "108 Years of Momentum Profits" by Dimson, Marsh and Staunton; "Momentum Crashes" by Daniel; Do Momentum Strategies Work? - Australian Evidence by Drew, Veeraraghavan and Ye, to name but a few.

The three factors that have historically played a key part in the Australian market, and indeed with many markets to varying degrees, have been momentum, value and size. Your analysis picks up momentum and by default I would suggest it also picks up a small cap bias.

The other component of your analysis is an equal weighted basket tends to out-perform a cap weighted basket. Again this could be related back to the ability of small cap stocks to out-perform large cap stocks.

With regards to shorting stock this was either limited or expensive during the heights of the GFC, and one suspects this would have curtailed the ability to implement and eroded returns. Also just a quick look at your ten stock basket captures six gold stocks and two steel stocks, which goes to the heart of your comment about sector diversification.

Regards

Rob


Leave a Comment:

RELATED ARTICLES

Market winners outperform losers again

How the S-curve helps to find winners and losers

Momentum of winning and losing share prices

banner

Most viewed in recent weeks

Why spending more in early retirement can improve lifetime income

Conventional wisdom encourages retirees to preserve superannuation. But if those likely to qualify for the Age Pension later in life spend a little more today, it may deliver higher lifetime income and a more stable retirement.

It’s time for LICs to die

A high-profile dividend cut and a prominent fund manager’s apology have reignited a long-running debate. If investors can access similar exposures more cheaply and efficiently elsewhere, what exactly is keeping LICs alive?

Is it time to bail on Australian stocks?

For generations, Australian investors have backed banks, miners and dividends. But has that loyalty come at a cost? A look at the numbers raises an uncomfortable question about where future returns will come from.

Testamentary trusts survived the trust tax. The drafting battle has just begun.

The fight over testamentary trusts looked settled. Then the draft legislation arrived. Hidden in a technical detail is a question that could force many families to rethink wills they thought were already future-proof.

The new capital gains tax trap for your portfolio

Investors have long accepted one portfolio rule without much question. A major tax shift could change that calculation entirely, forcing difficult trade-offs between risk, discipline and an overlooked cost lurking beneath.

The investing rule that explains the next market crash

What if investment success depends less on picking the right assets and more on understanding the decisions of other investors? A principle borrowed from game theory offers a different perspective on markets.

Latest Updates

Fixed interest

Higher yields are creating opportunities in global bonds

Bond markets are adjusting to a new reality, but not in the ways investors expect. With markets repricing and capital competing for attention, investors may need to rethink where resilience and opportunity lie. 

Economy

Are we in a recession?

What if the warning signs are already everywhere? From supermarket aisles to company failures, investors are being bombarded with recession signals. But most face a different risk that can be just as dangerous for portfolios. 

SMSF strategies

Meg on SMSFs - Division 296 actuarial certificates

The tax bill might be yours, but the event that caused it may not be. A key Division 296 calculation can sometimes attribute earnings in ways that many SMSF trustees won't instinctively expect or fully appreciate.

Property

The first impact of negative gearing reform is not the tax bill

Negative gearing changes formally begin in 2027, but the first consequences may already be here. A subtle shift is quietly influencing who can borrow, how much they can access and which property strategies still stack up.

Economy

The oil market is running out of easy answers

The biggest threat to markets may not be what investors are watching. The numbers have stopped adding up and supply is harder to measure, with forecasts becoming simple guesses. A more fragile reality is being masked.

Investment strategies

The state of investor knowledge in Australia

Australians are investing more than ever, yet a surprising divide is emerging between those building wealth effectively and those making costly mistakes. Surprisingly, the gap has little to do with income, age or starting capital.

Taxation

Complexity and capital gains

A case study shows that the ‘30% minimum CGT’ is a poorly conceived tax that adds significant complexity to an already over-complex system. A less complicated model would create a much fairer progressive tax scale.

Sponsors

Alliances

  • ASA-Logo-RGB-ActiveGreen-web.png

© 2026 Morningstar, Inc. All rights reserved.

Disclaimer
The data, research and opinions provided here are for information purposes; are not an offer to buy or sell a security; and are not warranted to be correct, complete or accurate. Morningstar, its affiliates, and third-party content providers are not responsible for any investment decisions, damages or losses resulting from, or related to, the data and analyses or their use. To the extent any content is general advice, it has been prepared for clients of Morningstar Australasia Pty Ltd (ABN: 95 090 665 544, AFSL: 240892), without reference to your financial objectives, situation or needs. For more information refer to our Financial Services Guide. You should consider the advice in light of these matters and if applicable, the relevant Product Disclosure Statement before making any decision to invest. Past performance does not necessarily indicate a financial product’s future performance. To obtain advice tailored to your situation, contact a professional financial adviser. Articles are current as at date of publication.
This website contains information and opinions provided by third parties. Inclusion of this information does not necessarily represent Morningstar’s positions, strategies or opinions and should not be considered an endorsement by Morningstar.