Over two years from the Covid crisis in March and April 2020 to now, the market delivered price jumps in hundreds of tech stocks followed by a harsh reality check. The reasons for the surge in prices were simple: trillions of dollars sprayed around by governments, deficit spending their way to wartime-like debts, to boost incomes, save jobs, and encourage spending.
On top of this, central banks threw away their textbooks and set about to deliberately create inflation, cutting rates to zero (negative in Europe and Japan), and resorting to straight-out money-printing, to entice people to gear up to the hilt and spend. People everywhere threw their free or ultra-cheap money at just about anything, especially online retailing, tech, renewables, ‘crypto’ currencies, ‘NFTs’, and even boring old housing.
The days of reckoning
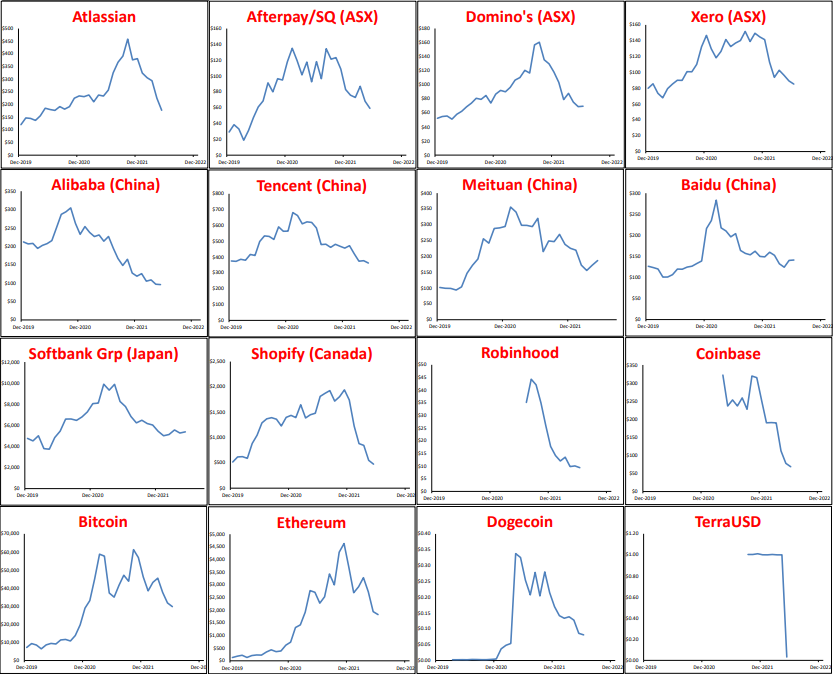
Here is a quick snapshot of the rise and fall (thus far) of the post-Covid tech fever. Below are price charts for a couple of dozen stocks since the start of 2020 – ie just prior to the February-March 2020 Covid sell-off. At the top we start with the broad US S&P 500 and NASDAQ indexes, then several US tech/online stocks, and some key stocks in other markets, including Australia. We also include some crypto’s, including the terraUSD ‘stable coin’.
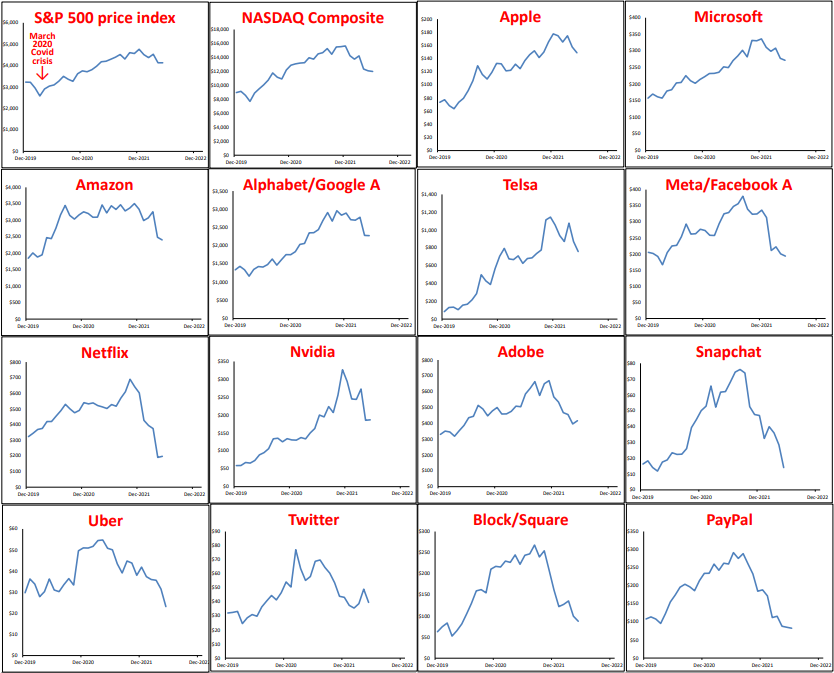
We have used no charting trickery to make price moves appear greater than they actually are. On each chart, the left scale starts at zero at the bottom, so if a price looks like it has doubled, or trebled or risen ten-fold (like Tesla and Bitcoin), or has fallen by more than half (most of them), then they have.
This is not intended to be exhaustive. It is to illustrate that the patterns are virtually the same in each case, regardless of the circumstances or merits of each individual company (or crypto).
As almost none of them pay dividends, half make losses, and most of the rest make only tiny profits relative to their prices, the charts reflect the rise and fall of mass hysteria – first surging in, and then fleeing.
Will the hysteria return to drive prices higher?
Is this just a temporary dip that will recover, or will the mass-selling continue, or pause?
Sentiment changed in early 2022, and the reasons are also clear. It was the sudden realisation that the era of free and ultra-cheap money is over. Inflation surged well before Russia’s invasion, and central banks finally started to end QE money printing, and raise interest rates back toward more ‘normal’ levels. There is much debate about exactly where ‘normal’ is for cash rates in each country, but it is certainly much higher than where they are now.
The bell at the top of the market was probably the January 2022 Superbowl, dubbed the ‘crypto Superbowl’, which featured slick ads showing famous movie stars spruiking cryptos as a sure way to get rich. (This is fitting, as the bell at the top of the late 1990s ‘dot com’ boom was the January 2000 Superbowl, dubbed the ‘dot-com Superbowl’. It featured TV ads for 14 profit-less ‘dot-com’ start-ups that promptly crashed in the 2001-2002 ‘tech wreck’).
Will central banks suddenly switch back to rate cuts and QE? Not while inflation is running well above target, unless there is another major economic contraction (deep recession with high unemployment, like the in 2020). If that does occur, share markets would have already fallen and started to rebound by then.
On the ‘fiscal’ (government spending and taxes) front, governments are still deficit spending, but the pace of spending increases has slowed significantly, and many programs have ended. Governments are under pressure to scale back spending, and are even talking of raising taxes (eg. tax hikes in Joe Biden’s election policy agenda).
Is pricing now more reasonable?
Has the recent sell-off brought prices back down to levels that are now ‘fair’ or reasonable (or perhaps even cheap?). Here are the price/earnings ratios and dividend yields for the broad market and for our tech/online stars:
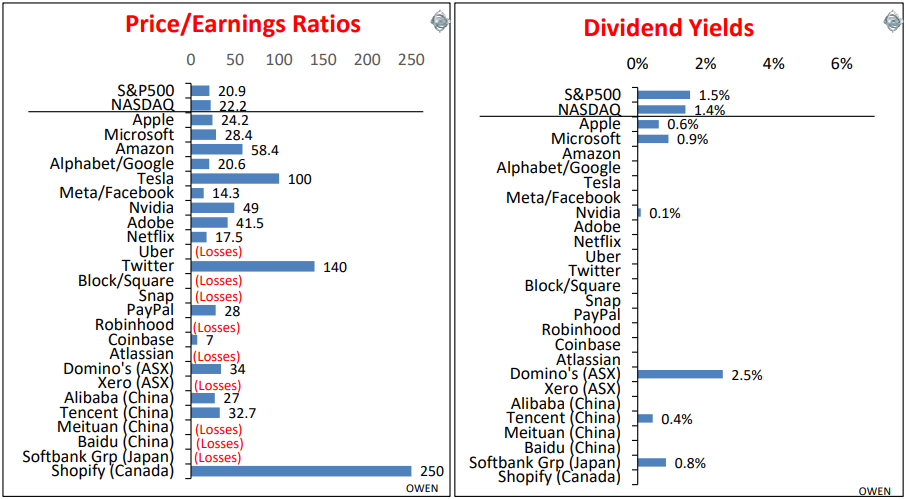
On the left, we can see that price/earnings ratios are a not-too-expensive 21 for the US market as a whole. As a general rule of thumb, a P/E ratio above the high teens is getting expensive, and is only justifiable if the company can generate and sustain above-market profit growth well into the future. Here we see that the P/E ratios of the tech and online stars are well above that in almost all cases. Half of them make losses, so they don’t even have any ‘E’ (earnings) for us to calculate the P/E.
The current high pricing relies on assumptions of continued boom-time rates of profit growth, and many of these are going to be a lot more difficult to sustain as monetary and fiscal support is withdrawn, and as higher inflation and interest rates constrain spending, revenues, margins and profits.
The right chart highlights that there is almost a complete absence of cash dividends. This is important for the broader market, as the top half dozen stocks on the list are not just large tech/online stocks. They are the largest companies in the US market, and the largest in the entire world, so they drive global returns. (Australia’s Domino’s Pizza is seen as a hot tech stock for some bizarre reason, but it is by far the biggest dividend payer).
These numbers suggest profits need to remain strong (with inflation and interest rates not rising too high) or prices have further to fall.
Ashley Owen is Chief Investment Officer at advisory firm Stanford Brown and The Lunar Group. He is also a Director of Third Link Investment Managers, a fund that supports Australian charities. This article is for general information purposes only and does not consider the circumstances of any individual.