The FY23 earnings season wrapped up in August. In looking at the performance of Listed Investment Companies (LICs) and Trusts (LITs) over the year, this article examines pre-tax Net Tangible Assets (NTA) after tax on realised gains and before tax on unrealised gains for LICs and the Net Asset Values for LITs, as well as the dividends and distributions declared over FY23.
Performance of NTA/NAV and share prices versus indexes
For comparison purposes, we include the performance of relevant broad market indexes but index performance is reported before tax.
Over FY23, global markets performed better than the domestic Australian market with the MSCI World Index in AUD terms increasing 22.4%. The ASX All Ordinaries Accumulation Index rose 14.8%. Australian small caps recouped some of the losses from FY22, although underperformed large cap stocks with the ASX Small Ordinaries Accumulation Index up 8.4% over the 12-month period.
Here is how some major LICs and LITs performed.
Australian Equities - Large Cap
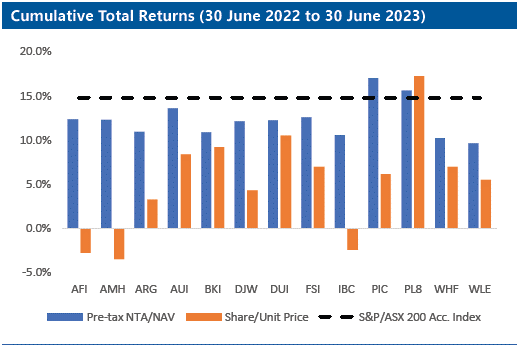
PIC and PL8 were the only two portfolios (based on the pre-tax NTA and NAV) that outperformed the S&P/ASX 200 Accumulation Index over the period, however, PL8’s returns are grossed up for franking credits. PIC’s portfolio was buoyed by its international equity holdings with its largest global holding, Flutter, up over 100% in FY23.
However, while all portfolios delivered positive returns, share prices dislocated from portfolio performance. Notably, AFI’s shareholder return was negative for the period as the share price re-rated from a substantial premium back towards the portfolio value. The insatiable appetite for the fully-franked monthly dividends saw PL8 trade at a substantial premium to pre-tax NTA.
Australian Equities - Mid and Small Cap
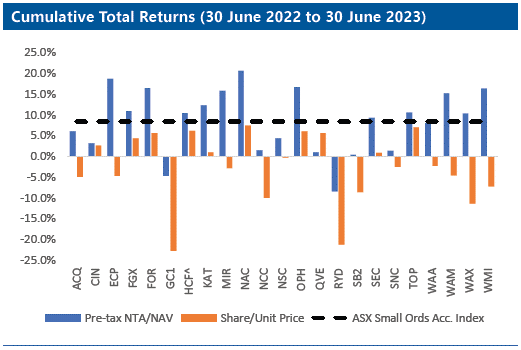
< HCF returns are from 31 October 2022 to 30 June 2023 as the company has less than 12 months of performance history.
The portfolio performance of the Australian Mid and Small Cap category was mixed as only 13 of the 23 LICs/LITs outperformed the ASX Small Ordinaries Accumulation Index although all but two LIC/ LIT portfolios generated a positive return. This compares to the FY22 period where no LIC/LIT in the category had a positive portfolio return, a period where the ASX Small Ordinaries Accumulation Index was down 19.5%.
After NAC, OPH, ECP and FOR had the worst-performing portfolios in the FY22 period, these four LICs/LITs had the best-performing portfolios in the FY23 period. While all four LICs and LITs bounced back strongly, none recouped all the declines experienced in FY22.
While portfolios performed strongly, the same can’t be said for shareholder returns, with shareholder returns weak compared to portfolio performance. Despite only two portfolios posting a negative return over the FY23 period, 13 had negative shareholder returns, with the two LICs/ LITs that had negative portfolio returns hit the hardest.
WAA, WAM, WAX and WMI all had negative shareholder returns as the market prices re-rated back towards portfolio values. While WAM maintained its dividend for the FY23 period, the sustainability of the dividend is coming under increasing pressure with the share price reflecting the increased risks associated with the sustainability of the dividend. WAM traded at a discount in the FY23 period for the first time in 10 years. While the share price has factored in some of the risk, we think the share price will likely come under further pressure in the event of a dividend cut.
Despite ECP and MIR generating portfolio returns of in excess of 15%, shareholder returns were negative with both LICs trading at discounts as at 30 June 2023.
International Equities - Diversified and Emerging Markets
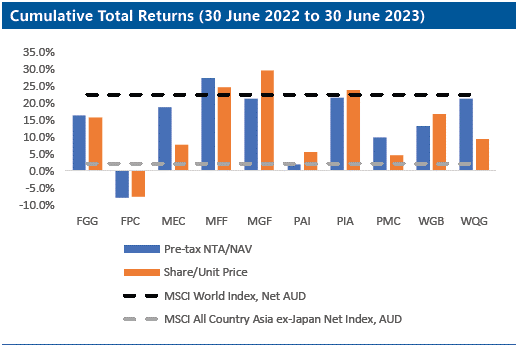
All but one LIC/LIT delivered a positive portfolio performance over the period with those portfolios with large exposures to the US market delivering the best performance.
PAI invests in the Asia ex Japan region, a market which significantly lagged the global market over the FY23 period. The MSCI All Country Asia ex- Japan Index in AUD terms increased just 2.1% with China being a significant drag for the region. This weighed on the returns of PAI, the pre-tax NTA of which delivered just below market returns for the period.
PMC had an overweight exposure to China over the period and a heavily underweight net exposure to the US which weighed on its returns for the period.
International/Australia Equities – Blended
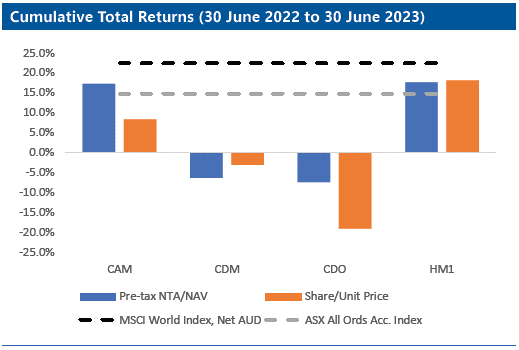
The portfolios of CAM and HM1 performed strongly over the FY23, rebounding from the declines in the FY22 period. While improved, the HM1 portfolio still has some way to go to make up for the substantial declines in FY22. HM1 has embarked on a number of changes with regards to the construction of the portfolio in response to the declines experienced in FY22.
CDM and CDO both experienced declines in the portfolio performance. Both LICs had high levels of cash over the period, which provided a level of downside protections but was also a drag on the portfolio when compared to the market returns. CDO’s shares sold off to a greater extent than the portfolio decline which resulted in the LIC trading at a discount at 30 June 2023.
Absolute Return
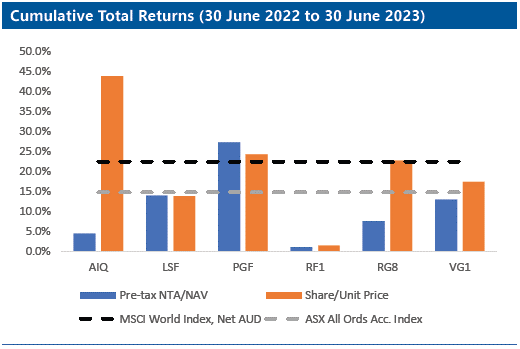
PGF continued its strong performance over the FY23 period with the portfolio being the best performer in the category. After the substantial underperformance of the broader market in FY22, the VG1 portfolio pared back some of the losses, with the pre-tax NTA increasing 13.0% for the FY23 period. Shareholders also received some reprieve with the shareholder return outperforming the pre-tax NTA as a result of the discount narrowing. However, the company continues to trade at an expanded discount.
LSF generated a positive return over the period with the pre-tax NTA being one of the better performers of the peer group over the short-and-medium term periods. However, with the high watermark as the performance hurdle, shareholders have seen significant fee leakage in the last two financial years.
RF1’s portfolio saw a marginal increase over the FY23 period. During the year, the Trust added three new strategies to the portfolio, diversifying the portfolio by asset class and strategy with the addition of the Water Strategy, the Private Credit Strategy and the Resources Royalties Strategy.
Fixed Income
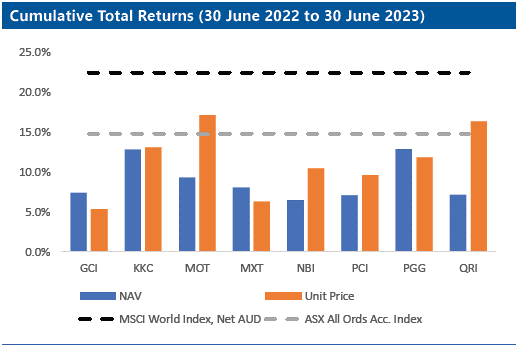
The Fixed Income LITs performed strongly with the unitholders of portfolios exposed to floating rate securities benefiting from the rising interest rate environment.
The LITs that provide exposure to direct loans continued to maintain steady NAVs, providing an increased income stream and low levels of capital volatility.
During the year, there were periods at which some of the LITs providing exposure to direct debt were trading at elevated discounts with the expectations of a slowdown weighing on market prices. As fears eased and inflation subsidised from its peak the private debt LITs that are considered to provide riskier exposure, MOT and QRI, re-rated back towards their NAV with unitholder returns outperforming NAV returns over the period. QRI’s unit price was further buoyed by the introduction to the ASX All Ordinaries Index after being reclassified as a MREIT.
After experiencing significant declines in FY22 due to the exposure to predominantly fixed rate high yield bonds, NBI generated a positive performance for the FY23 period.
Dividends and distributions
LIC and LIT share/unit holders fared well with 79% of LICs and LITs either maintaining or increasing their ordinary dividends/distributions on the prior year. The trust structure of LITs means they are required to pay out all income and realised capital gains generated in any given year. As such, distributions are dependent on the performance of the portfolio in any given year which can lead to high levels of distribution volatility. This compares to the company structure of LICs, which allows them to reserve income and capital gains for future dividend payments.
Tribeca Global Natural Resources Limited (ASX: TGF) and H&G High Conviction Limited (ASX: HCF) paid maiden dividends during the period with HCF listing during the FY23 period.
As a category, the Fixed Income LITs delivered the greatest increase in distributions with a median increase in distributions for the FY23 period of 34.6%. Fixed Income LIT unitholders benefited from the increasing interest rate environment.
Australian Equities - Large Cap
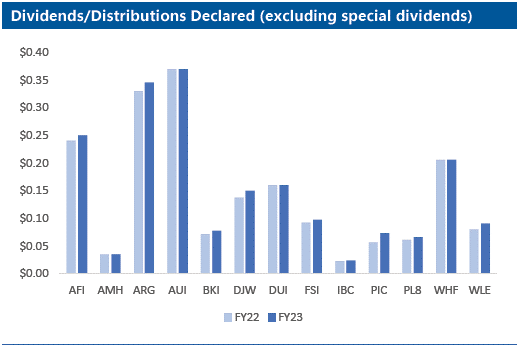
All Australian Large Cap LICs and LITs either maintained or increased the ordinary dividends/distributions for the FY23 period.
PIC delivered the greatest increase in dividends with a 30.4% increase in ordinary dividends with the LIC delivering the greatest full year dividend in its history in the FY23 period. The dividend increase was a result of strong portfolio performance with PIC’s portfolio being the best performer in the category over the FY23 period, as discussed above.
WLE continued to increase the dividend with the LIC increasing the dividend amount in each financial year period since the commencement of dividend payments in 2017.
DJW continued to deliver improved dividends with dividends increasing 9.1% for the FY23 period to 15 cents per share. The increased dividend reflects the Company’s revised dividend policy in which the dividend will reflect the Net Operating Profit per share (which excludes the impact of open option positions). The amended dividend policy provides a more sustainable dividend policy for the Company while allowing for potential NTA growth. The Company has paid an increasing dividend in each semi-annual period since the lows of the interim dividend in FY21, reflecting the improved Net Operating Profit, which was back above 2019 levels in FY23.
Australian Equities - Mid and Small Cap
*LIT structure.
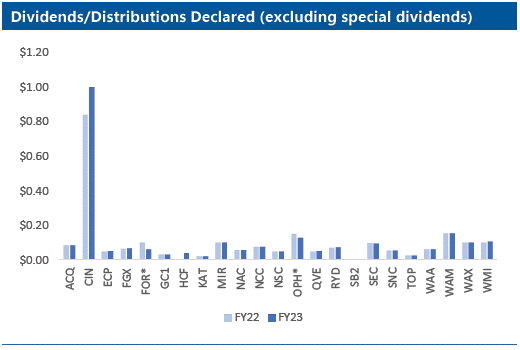
There were three LICs and LITs that declared declines in dividends/ distributions, two of which were LITs. Distributions of LITs can be volatile given LITs payout the distributable income in any given year which is impacted by both income received and realised gains. The third was Spheria Emerging Companies Limited (ASX: SEC), whose dividends represent a percentage of the post-tax NTA at the end of each calendar quarter. As such, dividends will increase or decrease in line with the post-tax NTA, subject to the company having sufficient Profits Reserve.
CIN delivered the greatest dividend increase, with the FY23 ordinary dividend 19% higher than the ordinary dividend declared for the FY22 period. The Company also paid a special dividend of 9 cents per share in the FY23 period. Despite the muted portfolio performance, QVE dividends increased 8.3% in the FY23 period.
WAM maintained the full year dividend for the FY23 period of 15.5 cents per share. The dividend coverage levels are depleted at the annual dividend rate, however in an investor webinar the Chair made it clear that the Company would be seeking to maintain the dividend until it is forced to make a cut. To continue to maintain the dividend, the portfolio will have to supplement income received by the investee companies with sufficient capital gains. WAX maintained the final dividend for the FY23 period, however the dividend was 60% franked as opposed to being fully franked.
International Equities - Diversified and Emerging Markets
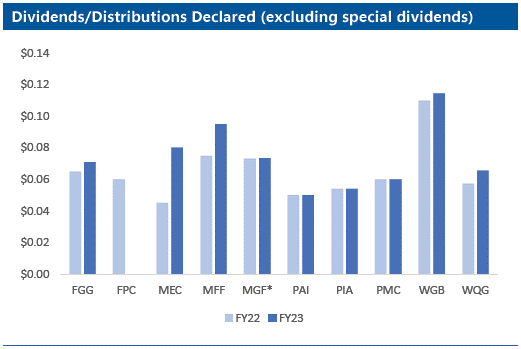
*LIT structure.
All but one LIC/LIT in the International Diversified and Emerging Markets category at least maintained the dividends/distributions for the FY23 period with 60% of the LICs/LITs in the category increasing the dividend/ distribution.
MEC declared the greatest dividend increase for the FY23 period in the category, with dividends increasing 77.8% to 8 cents per share. Post the FY23 interim dividend, WQG increased the frequency of dividends from semi-annual to quarterly with the Company paying one semi-annual and two quarterly dividends for the FY23 period. Dividends declared for FY23 of 6.55 cents per share represented a 13.9% increase on the prior year.
International/Australia Equities - Blended
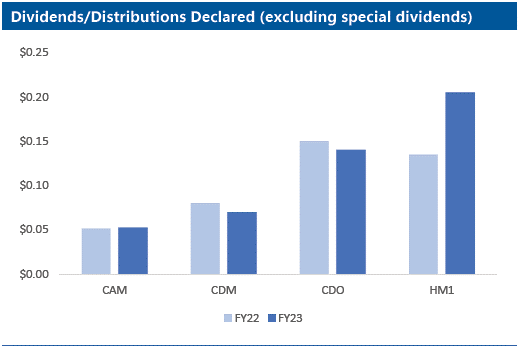
HM1 has increased the frequency of dividends from annual to semi-annual. HM1 declared the first semi-annual dividend for the half year period to 30 June 2023 of 7 cents per share. This was in addition to the annual dividend of 13.5 cents per share paid in April 2023. This saw the dividends declared for the FY23 period increasing 51.9% on the prior year.
CAM’s dividends slightly increased in the FY23 period with dividends up 2.5% when compared to the prior year. CAM paid an increased dividend in each of the quarterly dividend payments for the FY23 period. CDM and CDO dividends declined 12.5% and 6.7%, respectively, in the FY23 period with the final dividend for both LICs declining from the pcp. The dividends were cut for both LICs due to the depletion of the franking credit accounts. To maintain a fully franked dividend, the Company will need to accrue additional franking credits or alternatively potentially cut dividends further.
Absolute Return
*LIT structure.
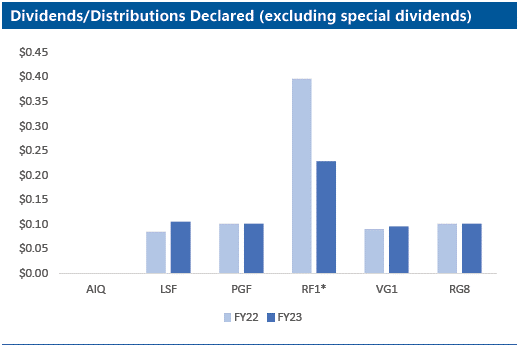
The majority of Absolute Return LICs/LITs either maintained or increased ordinary dividends/distributions for the FY23 period. PGF maintained the full year dividend for FY23 of 10 cents per share, fully franked, in line with guidance provided to the market at the beginning of the financial year. PGF announced in their FY23 results that the Company intends to pay a minimum dividend of 10 cents per share, fully franked, for the FY24 period.
VG1 increased the final year dividend for the FY23 period to 5 cents per share, fully franked, resulting in a 5.6% increase to the full year dividend declared for the FY23 period. VG1 has a dividend policy to pay a semi-annual dividend of at least 4.5 cents per share, franked to the maximum extent possible.
LSF continued to steadily increase the dividend, with the Company declaring a full year dividend of 10.5 cents per share, a 23.5% increase on the prior year. LSF has paid an increasing dividend in each semi-annual period since the Company commenced paying dividends.
Fixed Income
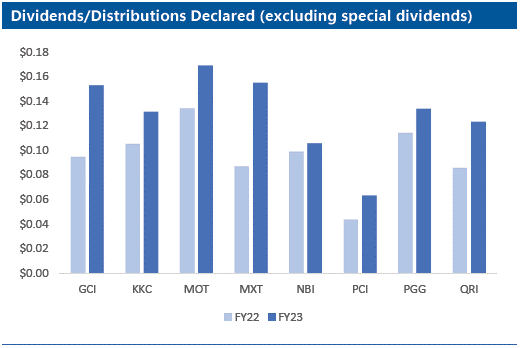
Fixed income LITs experienced the greatest increase in distributions as a category with those LITs with exposure to floating rate securities benefiting from the increasing interest rate environment.
MXT delivered the greatest increase in distributions with distributions increasing 77.9% on the prior period. GCI, PCI and QRI also delivered substantial increases in distributions of 61.3%, 43.8% and 43.3%, respectively.
KKC’s distributions increased 26% on the prior year and in June 2023 announced the target yield for the FY24 period would increase 52% to 20 cents per unit. NBI is largely exposed to fixed rate securities and therefore did not realise the same uplift in distributions as those LITs that are exposed to floating rate securities.
Potential gains from active management and discounts narrowing
Given the uncertainty in markets, we believe this is a good time to be exposed to actively-managed investments with active managers often outperforming markets during periods of uncertainty and heightened volatility. We saw this in the rebound from the COVID-19 market declines where a number of managers outperformed.
With a number of LICs and LITs trading at elevated discounts, this may be an attractive time to invest in closed-ended vehicles with the potential to generate additional capital returns in the event the discounts narrow. We note however, that it is important to understand the investment strategy and mandate of a LIC/LIT and the impact that differing market conditions may have on the performance of a LIC/LIT.
Claire Aitchison is Head of Equities & Funds Research at Independent Investment Research. This article is general information and does not consider the circumstances of any investor.
For a copy of the full report, see the Firstlinks Education Centre or this link.