While market performance during the first half of last financial year was mainly impacted by COVID-19 factors, the second half was predominantly affected by Russia invading Ukraine, global central banks raising interest rates and the continuation of China’s zero COVID-19 policy.
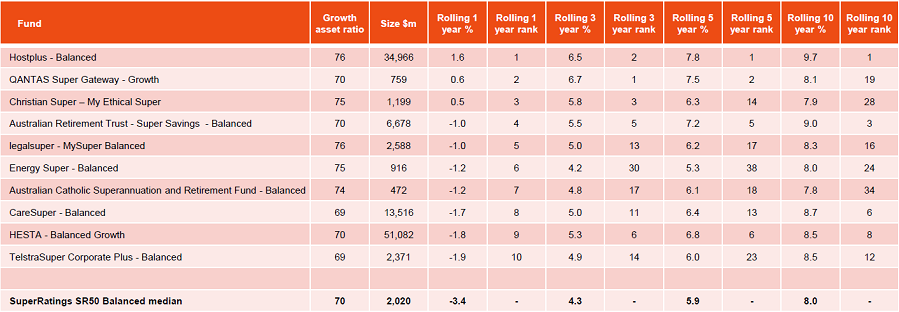
Over the entire FY22, the median superannuation fund returned -3%, while property and infrastructure returned in the double digits. With equity markets struggling and a selloff in bond markets, performance was quite weak for MySuper member options. Most funds produced negative returns, with performance across the top 10 funds ranging from -1.9% to 1.6%. Strategies with a larger proportion of unlisted assets across infrastructure, property and private equity performed better.
Table 1 below ranks the performance of the top 10 super funds covered by SuperRatings' reporting for the one-year period through June 2022. It includes growth asset ratio, size of the fund and multiple rolling time periods through 10 years.
Table 1: Performance through 30 June 2022
Source: SuperRatings
Outperforming funds with lower risk
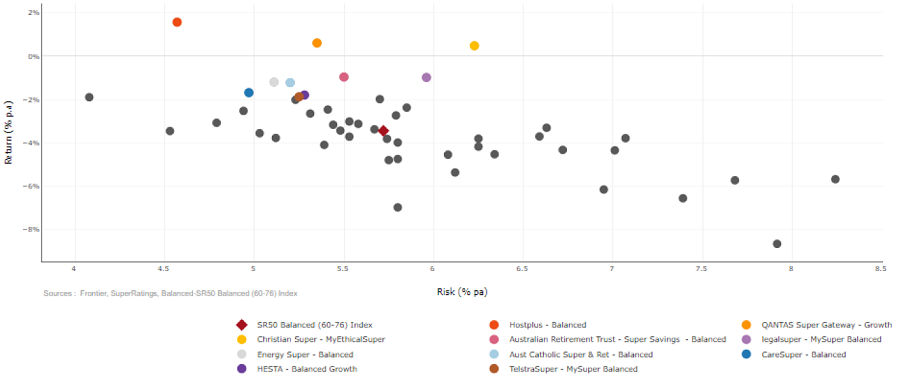
Chart 1 shows performance and risk as defined by the standard deviation of returns for the 12 months to 30 June 2022. The majority of the outperformance of the top 10 funds exhibited lower standard deviation (risk) than the median with the exception of legalsuper and Christian Super.
Chart 1: SR50 Balanced funds standard deviation versus one year return to 30 June 2022
Note: The dark grey circles on the chart represent all other funds
Asset allocation
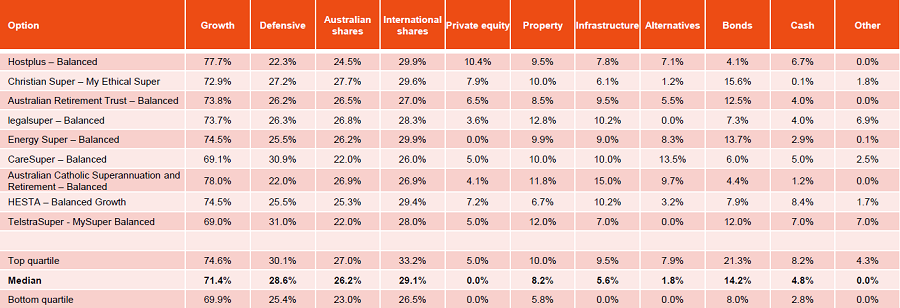
Based on the most recent asset allocations shown in Table 2, funds with greater exposure to unlisted assets across private equity, property and infrastructure performed well (noting some funds classify these exposures as alternatives or other).
Table 2: Universe asset allocation
Source: Frontier, SuperRatings
Unlisted assets boosted returns
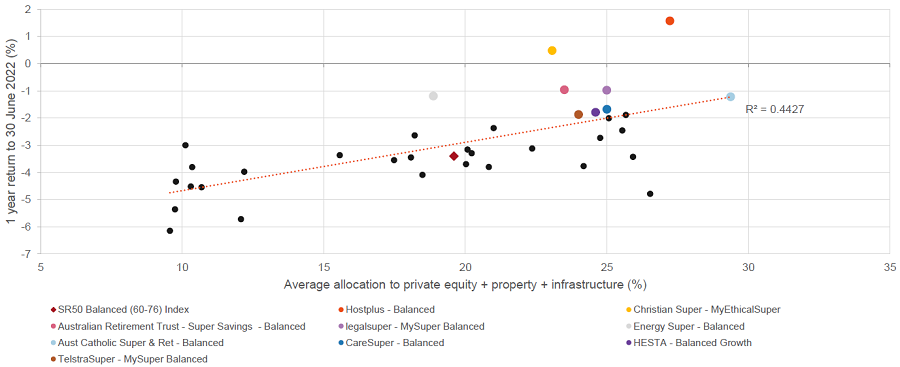
Chart 2 shows the correlation between the total allocation to private equity, property and infrastructure versus the performance during the year.
It shows a strong correlation. Funds with higher allocations achieved better performance. Most of these assets are unlisted (particularly for profit-for-member funds) and undergo periodic revaluations which often lag listed markets and indices. As a result, they have held up better during a period of risk-off sentiment across markets.
Chart 2: SR50 Balanced funds – correlation of private equity, property and infrastructure allocation versus one-year performance to 30 June 2022
Note: The dark grey circles on the chart represent all other funds
The question of whether size matters
Funds are required to undertake an annual member outcomes assessment of whether its members are disadvantaged by virtue of the fund’s scale.
Similar to last year, size of fund was not a significant predictor of return. Only three of the top ten performers had assets greater than $30 billion, while five had less than $15 billion. Other ‘small’ funds, such as First Super and MIESF not included in the SuperRatings survey, also posted positive returns. While the poorest-performing funds all had less than $5 billion, many other funds of similar size produced very good performance.
Over a 10-year period, this metric shows a stronger correlation between size and performance. Funds greater than $10 billion have had better performance on average. While funds with better performance attract more new members, it is unclear whether the larger funds have better performance because they are large, or whether they are large because they have better performance.
Chart 3: One-year to 30 June 2022 | Chart 4: 10 years to 30 June 2022

Source: SuperRatings
Does longer-term performance equate to persistent outperformance?
With superannuation being a long-term investment, members should be looking for a fund with good performance consistency rather than just one good year. When examining the performance of the top 10 funds over the 10 years to June 2022, only four of these funds were ranked in the top 10 for FY22. In fact, four of the funds were below average over FY22.
AustralianSuper and HESTA stand alone in terms of performance consistency in this analysis. They are the only funds which have outperformed the average fund in each of the last 10 financial years. Somewhat unsurprisingly, given their higher allocation to growth assets and younger membership demographic, Hostplus has either appeared near the top or the bottom, but never near the middle, in individual years, while much more frequently in the former.
Most of these funds have had two or more years when their performance in a year has been below average. Only three funds have had at least one year when their return ranked them in the bottom quartile of peers.
A lesson well understood by many in the industry, but perhaps less so by fund members and other parties, is that a single year of good performance does not necessarily result in good long-term performance. Similarly, a couple of underperforming years across a decade does not translate to poor longer-term returns.
Performance in different markets
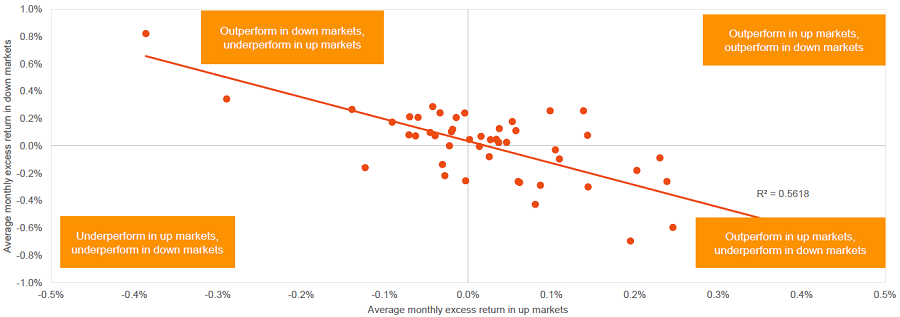
Chart 5 shows the average monthly excess return in down markets versus the average monthly excess return in up markets. The chart, analysed over a 5-year period, shows that not many funds are good in both up markets and in poor markets. The majority of funds are taking more risk (outperform in up markets) or less risk (outperform in down markets).
Chart 5: Up and down market analysis five years to 30 June 2022
Source: Frontier, SuperRatings
The final word
Superannuation is a long-term investment and it is long-term returns which impact final member outcomes. Analysing short-term performance can be helpful, especially in understanding how performance was achieved and whether there are any trends. Waiting 10 years to determine a fund is persistently underperforming could negatively impact a members’ final benefits.
However, basing an assessment of a fund on one year of good performance has limitations. As we have highlighted in this report, funds which do well in strong equity markets can find it more challenging when those markets decline. Allocations to unlisted assets can help returns, as their valuations are less influenced by the fluctuations in market sentiment.
Basing an assessment on longer-term performance has more appeal. However, care is needed to differentiate between those funds which have done well in the past and those funds which may do well in the future.
A robust assessment across a wider range of factors is needed to be satisfied each fund is of appropriate quality and provides good value for members. A ‘bright line’ test based on a single metric will misrepresent the complexity of ‘past performance being a guide to the future’. Instead, we believe a better outcome comes from analysing:
- Investment performance measured across multiple time periods, and consideration of the level and nature of investment risk.
- Level of fees and costs, particularly where these are increasing.
- Size of assets and cashflow position, especially if the cashflow is negative.
- Fund governance, business management and trustee oversight.
- Other factors, such as member services and other qualitative factors.
The focus should be on improved outcomes for members over the long-term.
David Carruthers is a Principal Consultant and Head of Member Solutions at Frontier Advisors. A full copy of this report can be accessed here. This article is general commentary and should not be regarded as financial, legal or other advice. It has been prepared without taking into account your objectives, financial situation or needs. Investors should seek individual advice prior to taking any action on any issues raised in this article.