In a recent article on Firstlinks on the extraordinary growth in the Magnificent Seven, the US’ mega-cap tech giants, and the resultant level of concentration in the S&P500 and Nasdaq indices, one reader commented that the level of concentration seen in US markets is actually rather low compared to other developed markets. And also that the current level of concentration in US markets is far from unprecedented. Both these points are accurate, but are they comforting?
To recap, Microsoft (MSFT), Apple (AAPL), Nvidia (NVDA), Amazon (AMZN), Meta (META), Alphabet (GOOG) and Tesla (TSLA) now comprise around 28% of the S&P500; in early March they comprised around 30%. A nearly 43% year-to-date fall in Tesla has been the primary detraction, while Nvidia has gained an incredible 65% over the same timeframe. Over the past five years, these companies have delivered nearly 50% of the performance of the S&P500; they also fell, collectively, 39% during the market’s contraction in 2022, nearly twice as much as the overall index.[1]
In the past, high levels of concentration in US markets have often preceded significant sharemarket falls – the tech wreck is one of the better examples. The 1960s and 70s ‘Nifty Fifty’ period was similar. This period doesn’t have to follow the same path – in fact, Goldman Sachs has just published a paper saying that while narrow leadership in the S&P500 usually occurs toward the top of the market and is followed by a period of significant underperformance, this era’s leaders should continue to outperform. Maybe this time really is different?
It should be noted that concentration at the top end of share markets outside the US is also not unusual, and the performance of a few large or mega-cap companies can significantly drive the performance of a single market. In Australia, financials comprise 30% of the S&P ASX200; while materials constitute a smaller proportion, BHP alone is more than 10% of the index[2]. The Swiss Market Index is only comprised of 20 stocks; a rule was introduced in 2017 to cap any individual stock at no more than 18% of the index when Nestlé, Novartis and Roche accounted for more than 60% of the SMI. The UK is dominated by four companies – AstraZeneca, Shell, HSBC and Unilever, which accounted for 25% of the FTSE100 at the end of February[3].
What's the big deal about the US, then?
So why does concentration in the S&P500 garner so much attention? In large part, this is because US markets dominate global portfolios; increasingly so as the US economy outperforms other developed economies, and as its tech giants dominate global demand for ecommerce, cloud technology and social media, not to mention artificial intelligence. US exposure now accounts for more than 70% of the MSCI World Index; the next highest weighting is Japan at just 6%. The top ten companies in the index comprise more than 20% of the index; Microsoft alone is larger, by weighting, than the United Kingdom[4].
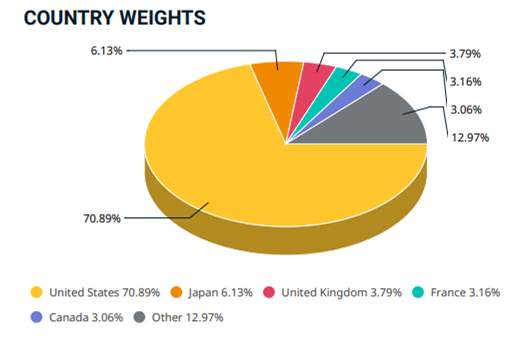
Source: MSCI
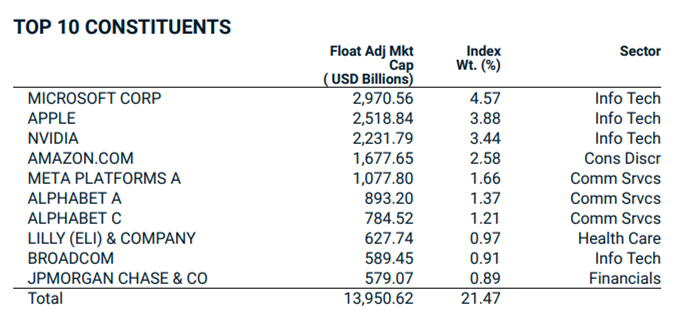
Source: MSCI World
Admittedly MSCI World is a developed market index; for a broader comparison, MSCI ACWI (All Country World Index), which covers 23 developed markets and 24 emerging markets, may be more relevant. ACWI has 63% exposure to the US. The top 10 stocks comprise a little less than 20% of the overall index, and includes Taiwan Semiconductors (TSMC) as a lonely non-US significant holding.
It can be a problem for fund managers
Superannuation funds and other large portfolio managers are generally benchmarked against these indices, and the composition of their global equities exposure reflects this. If a fund’s performance is compared to a benchmark, then mega-cap concentration is a real problem.
This issue is playing out in real time for global asset managers. Those who have not been holding – or have even just been underweight - the Magnificent Seven have dramatically lagged those who have, and also lagged low-cost index funds. This puts their entire business model at risk – why pay an active fee when an index fund delivers a better result? As a result, many pension funds and other large institutions have been forced to buy the mega-caps at what they feel are inherently overvalued prices because their performance – and revenues - suffer too greatly if they don’t.
Ultimately, any concern around concentration risk in a portfolio is linked to the principle that diversification smooths and ultimately improves returns over time. This is most relevant for long term investors – traders can afford to be highly concentrated in their portfolios because they’re actively managing positions.
Long term investors – like superannuation funds - are generally looking to hold their positions for five years or more, which has the advantage of minimising transaction costs (including brokerage and tax), which can critically impact net returns. Having a concentrated portfolio over the long term has obvious risks – that you’ve invested in a few stocks that perform poorly, or missed those that are performing well.
This time really could be different
As an individual investor, this may not be a concern for you. If you are invested in the growth option of a retail, corporate or industry super fund, you have some exposure to this risk – but you may feel that you would like exposure to these companies and the US in particular. nabtrade’s customer data is a really interesting insight into investors’ views on this – the number of investors who invest in ASX200 ETFs (usually VAS) is many multiples of the number who invest in ETFs with global exposure.
The ETF with international exposure held by the most investors is Vanguard’s MSCI Index International Shares (VGS) – a replication of MSCI World. Compare this to direct international exposure – more than 90% of direct international trades on nabtrade are made on US exchanges. And which stocks are most popular? Tesla, Microsoft, Apple, Amazon and Nvidia. Perhaps Goldman Sachs is right this time.
[1] Source: Refinitiv
[2] Source: S&P Global
[3] Source: S&P Global
[4] Source: MSCI
Gemma Dale is Director of SMSF and Investor Behaviour at nabtrade, a sponsor of Firstlinks. Index charts as at 12 February 2024. This material has been prepared as general information only, without reference to your objectives, financial situation or needs.
For more articles and papers from nabtrade, please click here.
Full Disclaimer: The content is produced and distributed by WealthHub Securities Limited (WSL) (ABN 83 089 718 249)(AFSL No. 230704). WSL is a Market Participant under the ASIC Market Integrity Rules and a wholly owned subsidiary of National Australia Bank Limited (ABN 12 004 044 937)(AFSL No. 230686) (NAB). NAB doesn’t guarantee its subsidiaries’ obligations or performance, or the products or services its subsidiaries offer. This material is intended to provide general advice only. It has been prepared without having regard to or taking into account any particular investor’s objectives, financial situation and/or needs. All investors should therefore consider the appropriateness of the advice, in light of their own objectives, financial situation and/or needs, before acting on the advice. Past performance is not a reliable indicator of future performance. Any comments, suggestions or views presented do not reflect the views of WSL and/or NAB. Subject to any terms implied by law and which cannot be excluded, neither WSL nor NAB shall be liable for any errors, omissions, defects or misrepresentations in the information or general advice including any third party sourced data (including by reasons of negligence, negligent misstatement or otherwise) or for any loss or damage (whether direct or indirect) suffered by persons who use or rely on the general advice or information. If any law prohibits the exclusion of such liability, WSL and NAB limit its liability to the re-supply of the information, provided that such limitation is permitted by law and is fair and reasonable. For more information, please click here.