Register For Our Mailing List

Register to receive our free weekly newsletter including editorials.

Home / 312

We have many world best practice companies

Overall, Australia’s businesses are way below world best practice (WBP) when it comes to profitability and have been for decades. Average returns on shareholder funds after tax (ROSF or Return on Investment, ROI) across the nation’s 2.3 million businesses have averaged just 3.7% over the past three decades (compared with the 10-year government bond rate averaging 5.5% over that period), although with a better 4.2% in 2018. Our largest 2,000 corporations averaged 6.9% ROI, and our Best 100 did a little better at 8%. The WBP level is 22%.

What do we mean by world best practice?

In this article, I have treated WBP as a company profitability level above 22% ROI, not a single 'best' as we might do with best practice in other comparisons (such as OH&S, triple bottom line, stakeholder action). Even with best practice processes and products there are often subtle if not significant differences.

It's instructive to see how WBP has evolved through the ages of economic progress.

  • The Agrarian Age, up to the late 18th century. WBP profitability was probably around the 10-year bond rate of about 5.5%.
  • The Industrial Age, up to the mid 1960s. WBP profitability was around double the bond rate, at about 11%.
  • The current Infotronics Age, to the middle of the 21st century. WBP profitability has doubled again to 22%. The added returns come from intellectual property, brand strength, culture, etc, which often remain off balance sheet although shareholders accept them as real in valuing a company. The massive change has been in the value of intellectual property ahead of the audited net assets.

Global performance comparisons

All of the ROI averages of Australian companies stated in the first paragraph are just over half the averages in the USA.

However, Australia had more than one in 10 of our largest 2,000 - that account for 46% of the nation’s $5.3 trillion revenue in 2018 - achieving WBP of 22% in ROI terms over the 3-year period to 2018. Sadly, three in 10 lost money over the same period.

We see the same performance gap in our 30 largest listed stocks (by market capitalisation) compared with the 30 largest NYSE-listed stocks (the Dow Jones Index list) below.
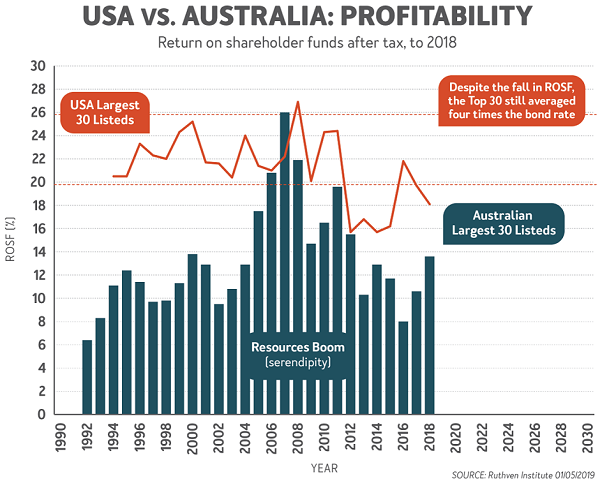
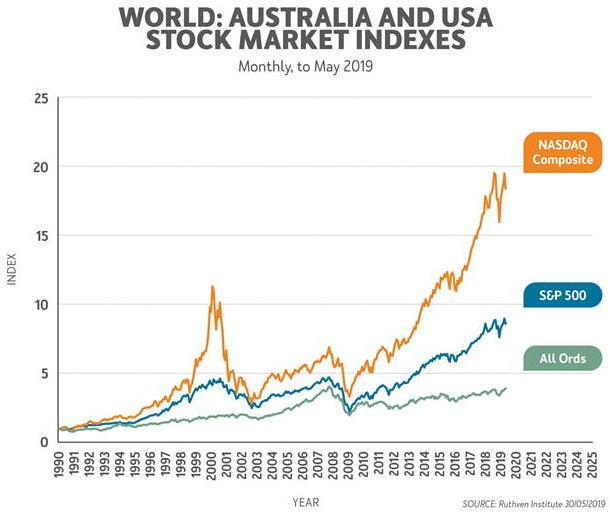
So, a lot of share portfolios and SMSFs have become more heavily weighted into US equities in recent times (directly or via managed funds and ETFs). That has been a no-brainer when one sees the diversity of performance between the All Ordinaries, S&P500 and NASDAQ in the next chart.
Tell us some good news about Australia

But, as always, there is good news as well as sobering news as shown below.
world best practice

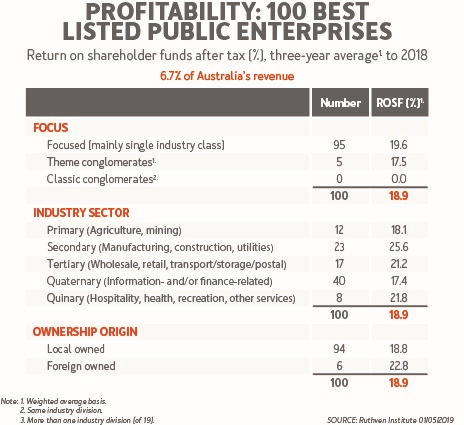
Some 42 companies in the Best 100 Listed Stocks achieved or bettered the WBP of 22% ROI in the three years to 2018, and the weighted average of the 100 was a commendable 18.9%.

The good performance took place across all five industry sectors with the toughest sector - the secondary sector of manufacturing, utilities and construction - performing best. Most of the 100 Best were focused companies with only five being diversified, and even they were theme conglomerates rather than dangerous classic conglomerates which all fail eventually.

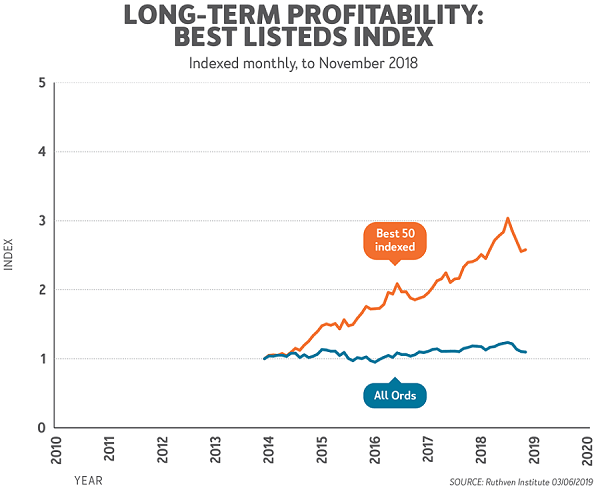
The best news of all is when we look at the Best 50 Listed companies over a 5-year period to 2018, and compare their weighted performance with the All Ordinaries Index, as below.
world best practice

A million dollars invested in the Best 50 five years ago would have yielded a capital value of $2.5 million by 2018, a 30% pa return, plus dividends. The All Ords would have been worth just $1.15 million plus dividends.

Our Best 50 not only outpaced the S&P500, but also the NASDAQ. It would seem fundamentals do matter.


Phil Ruthven is Founder of the Ruthven Institute, Founder of IBISWorld and widely-recognised as Australia’s leading futurist.

A full 40-page online Summary of the latest Business Performance results is available from www.ruthven.institute along with a staggering amount of other strategic information.

  •   26 June 2019
  • 2
  •      
  •   

RELATED ARTICLES

Why stock prices are a distraction

Is the speculative fever in 'hot stocks’ over?

Gullible travels, or are Aussies more sceptical?

banner

Most viewed in recent weeks

Why spending more in early retirement can improve lifetime income

Conventional wisdom encourages retirees to preserve superannuation. But if those likely to qualify for the Age Pension later in life spend a little more today, it may deliver higher lifetime income and a more stable retirement.

It’s time for LICs to die

A high-profile dividend cut and a prominent fund manager’s apology have reignited a long-running debate. If investors can access similar exposures more cheaply and efficiently elsewhere, what exactly is keeping LICs alive?

Is it time to bail on Australian stocks?

For generations, Australian investors have backed banks, miners and dividends. But has that loyalty come at a cost? A look at the numbers raises an uncomfortable question about where future returns will come from.

Testamentary trusts survived the trust tax. The drafting battle has just begun.

The fight over testamentary trusts looked settled. Then the draft legislation arrived. Hidden in a technical detail is a question that could force many families to rethink wills they thought were already future-proof.

The new capital gains tax trap for your portfolio

Investors have long accepted one portfolio rule without much question. A major tax shift could change that calculation entirely, forcing difficult trade-offs between risk, discipline and an overlooked cost lurking beneath.

The investing rule that explains the next market crash

What if investment success depends less on picking the right assets and more on understanding the decisions of other investors? A principle borrowed from game theory offers a different perspective on markets.

Latest Updates

Fixed interest

Higher yields are creating opportunities in global bonds

Bond markets are adjusting to a new reality, but not in the ways investors expect. With markets repricing and capital competing for attention, investors may need to rethink where resilience and opportunity lie. 

Economy

Are we in a recession?

What if the warning signs are already everywhere? From supermarket aisles to company failures, investors are being bombarded with recession signals. But most face a different risk that can be just as dangerous for portfolios. 

SMSF strategies

Meg on SMSFs - Division 296 actuarial certificates

The tax bill might be yours, but the event that caused it may not be. A key Division 296 calculation can sometimes attribute earnings in ways that many SMSF trustees won't instinctively expect or fully appreciate.

Property

The first impact of negative gearing reform is not the tax bill

Negative gearing changes formally begin in 2027, but the first consequences may already be here. A subtle shift is quietly influencing who can borrow, how much they can access and which property strategies still stack up.

Economy

The oil market is running out of easy answers

The biggest threat to markets may not be what investors are watching. The numbers have stopped adding up and supply is harder to measure, with forecasts becoming simple guesses. A more fragile reality is being masked.

Investment strategies

The state of investor knowledge in Australia

Australians are investing more than ever, yet a surprising divide is emerging between those building wealth effectively and those making costly mistakes. Surprisingly, the gap has little to do with income, age or starting capital.

Taxation

Complexity and capital gains

A case study shows that the ‘30% minimum CGT’ is a poorly conceived tax that adds significant complexity to an already over-complex system. A less complicated model would create a much fairer progressive tax scale.

Sponsors

Alliances

  • ASA-Logo-RGB-ActiveGreen-web.png

© 2026 Morningstar, Inc. All rights reserved.

Disclaimer
The data, research and opinions provided here are for information purposes; are not an offer to buy or sell a security; and are not warranted to be correct, complete or accurate. Morningstar, its affiliates, and third-party content providers are not responsible for any investment decisions, damages or losses resulting from, or related to, the data and analyses or their use. To the extent any content is general advice, it has been prepared for clients of Morningstar Australasia Pty Ltd (ABN: 95 090 665 544, AFSL: 240892), without reference to your financial objectives, situation or needs. For more information refer to our Financial Services Guide. You should consider the advice in light of these matters and if applicable, the relevant Product Disclosure Statement before making any decision to invest. Past performance does not necessarily indicate a financial product’s future performance. To obtain advice tailored to your situation, contact a professional financial adviser. Articles are current as at date of publication.
This website contains information and opinions provided by third parties. Inclusion of this information does not necessarily represent Morningstar’s positions, strategies or opinions and should not be considered an endorsement by Morningstar.