The ATO’s 2017-18 statistical overview of SMSFs provides a first look at the impact of the significant superannuation changes that took effect on 1 July 2017.
The primary source of data is 2017–18 SMSF annual returns. The key limitations associated are their frequency (annual) and their currency – the returns are not due until a long time after the end of the financial year. However, the ATO has used 2018–19 information for registrations, wind-ups, total populations, demographic data, estimated total SMSF assets and asset allocation, and auditor contravention reports (ACRs).
Part 1 of this article can be viewed here. It includes a granular examination of the costs of running an SMSF.
In the 2017-18 financial year, SMSFs made an average return of 7.5% compared with the 8.5% return for large Australian Prudential Regulatory Authority (APRA)-regulated funds. This continues the strong run of positive returns for SMSFs and according to this data over the last three years, comparable performance to the APRA funds.
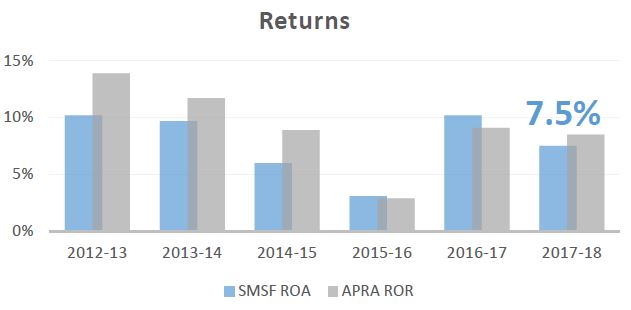
The SMSF Association has highlighted the difficulties in comparing return data, particularly due to definitions and member cohorts. The impact of COVID-19 will be interesting to watch over the coming reporting years.
Asset allocation in tax returns
(Editor's note: we have previously explained the shortcomings in the ATO asset allocation statistics, especially the reporting of 'Overseas assets' (see here and here). The data only represents direct investments in foreign stock exchanges when most Australians hold their foreign assets through listed and unlisted funds).
The below graph details the asset allocation of SMSFs in the ATO returns as at 30 June 2018.
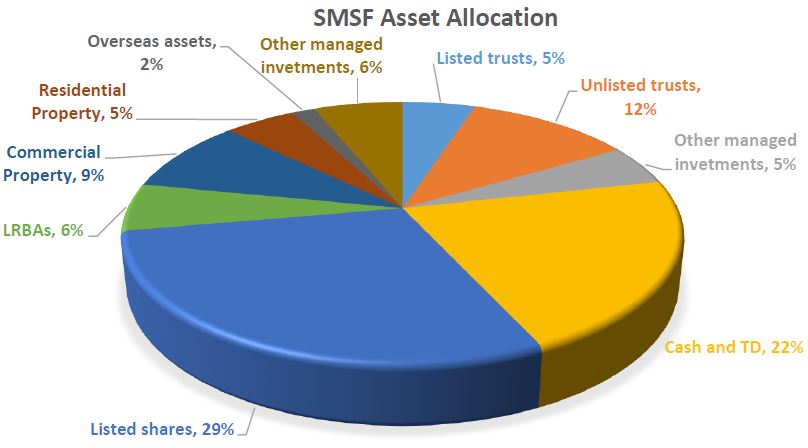
While this is some time before the COVID-19 pandemic, our understanding is that the asset allocation of SMSFs has not changed significantly between 2018 and 2020.
Therefore, going into the pandemic, SMSF asset allocation held a significant proportion invested in listed shares and cash. The key drivers for this asset allocation include:
- Tax preferences for domestic equities – fully refundable franking credits increase the after-tax return for domestic equities, especially for those in retirement phase.
- A desire for liquidity to pay pensions in retirement – this is especially relevant to the SMSF sector where 42% of funds are in retirement phase.
- Cognitive biases that drive allocation to assets trustees understand, especially blue-chip Australian companies.
A positive for the sector is that many SMSFs should be able to navigate through this pandemic from a better starting point than some of their counterparts.
Using an SMSF to meet pension requirements
The older cohort of investors requires more liquid assets to service their retirement living expenses. The benefits of the popular financial advice about holding two years of income in cash should bear fruit for many SMSF trustees.
A risk commonly raised in discussions on SMSFs is limited recourse borrowing arrangements (LRBAs). There is no doubt that in the current economic climate, where rental incomes may be reduced or suspended, some SMSFs with property may be facing unexpected risks. However, from a broader picture, the 2017-18 statistics highlight a flattening of LRBA growth and an acceptable level of LRBAs.
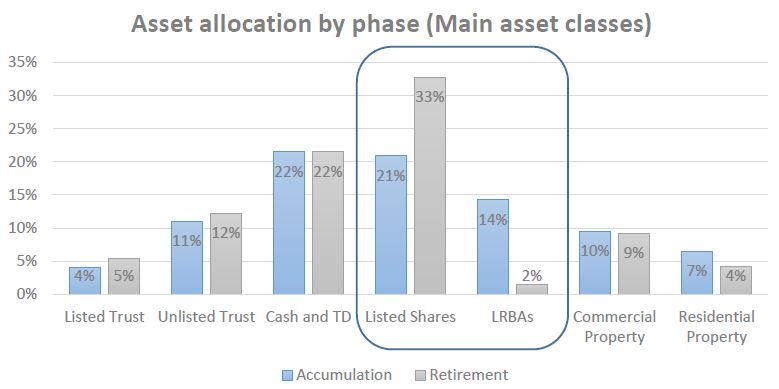
The graph below details the asset allocation of SMSFs by fund phase. When SMSFs enter the retirement phase, they are generally doing so without LRBAs and by holding more liquid assets, especially shares.
Growth, establishment and wind-ups
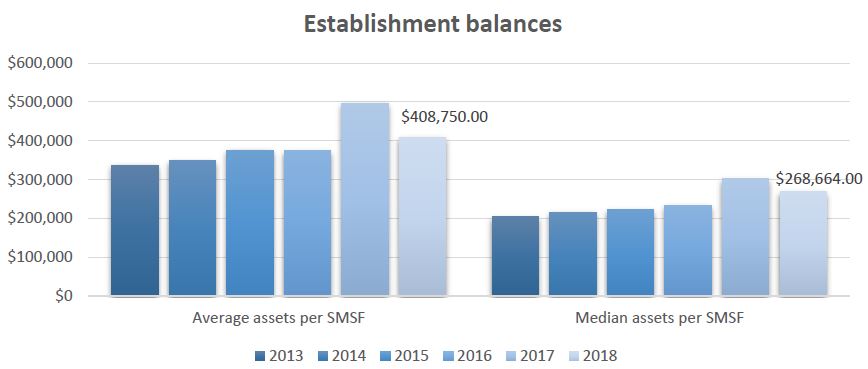
A significant takeaway in the ATO statistics is the increase in establishment balances for SMSFs in the last two years. It highlights that the majority of SMSFs were set up with an appropriate balance. The SMSF Association attributes some of this increase to the behavioural changes resulting in individuals establishing SMSFs with larger amounts due to the expected lower contribution caps allowed after 1 July 2017.
Promisingly, the 2017-18 statistics show the majority of SMSFs are being set up with a balance in excess of $250,000. Some SMSFs have been established with lower balances while expecting future contributions and roll-ins to be received within a short time frame.
In the five years to 2018, the number of SMSFs grew by an annual average of 2.9%. On average 28,490 new funds were established annually. However, the statistics show FY18 was the highest year on record for wind-ups.
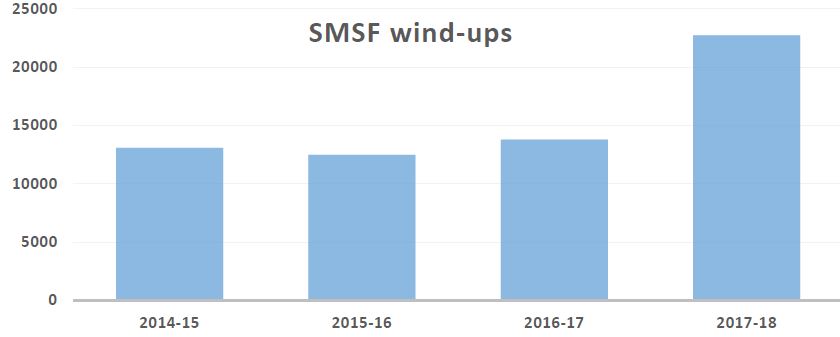
Early indicators suggest that the number of SMSF registrations has been increasing. The number of SMSF registrations received between July and December 2019 was 11,558. This compares to 10,954 for the same period the previous year, representing an increase of 5.5%. SMSF registrations for January and February 2020 were 3,246 compared to 2,807 SMSFs registered during the same period last year, an increase of 15.6%.
Contributions and benefit payments
In 2016–17, total contributions to SMSFs were $41.8 billion, while total SMSF benefit payments were $46 billion. These were both significant increases over the previous financial years, most of which can be attributed to a behavioural change resulting from the anticipation of the superannuation reforms taking effect on 1 July 2017.
With the release of the 2017-18 statistics, we now have a reversion to the norm.
- Total contributions to SMSFs peaked at $41.1 billion in 2016–17 before dropping 58% to $17.4 billion in 2017–18.
- The decline in contributions was most pronounced for member contributions, which peaked at $33.9 billion in 2016–17 before dropping 66% to $11.6 billion the following year.
- Total SMSF benefit payments decreased by 15% from $44.3 billion in 2016–17 to $37.7 billion in 2017–18.
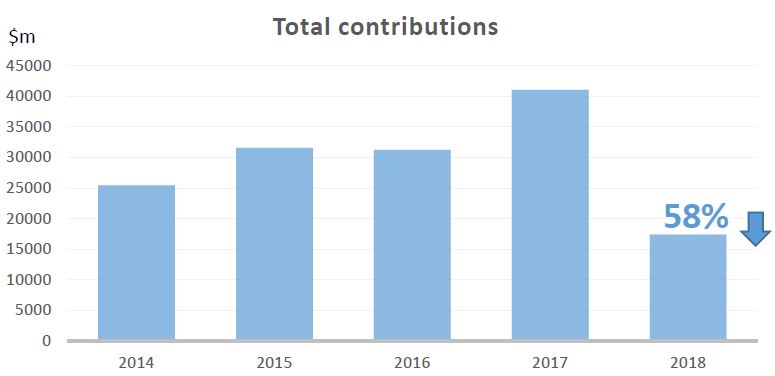
The decline in contributions was most pronounced for member contributions, likely due to many SMSFs using their three-yearly contribution bring-forward rule in the previous financial year.
Unfortunately, the statistics don’t detail the amount of money that moved from retirement phase into accumulation phase because of the Transfer Balance Cap (TBC). The data relating to the retirement phase is recorded once all members of the fund receive at least one pension payment.
However, we can see some of the impact in the type of benefit payment taken by SMSF trustees, as lump sums more than doubled in the financial year.
In the 2017-18 financial year, there was a significant increase in lump sum withdrawals from SMSFs. As SMSFs moved money into accumulation phase and the TBC took effect, they took the opportunity to withdraw funds as a lump sum to keep a larger amount in retirement phase. If lump sums were taken from the retirement phase this would create debits to their TBC.
Transition to retirement income streams were also out of fashion in the 2017-2018 financial year. This can be attributed to the loss of tax exemption status for these income streams.
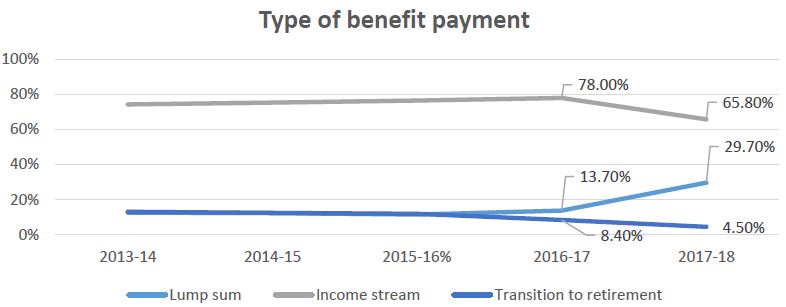
In the 2016-17 year, $31 billion was paid out in income stream payments. In the 2017-18 year, this fell to $20 billion.
Franco Morelli is Policy Manager at the SMSF Association. This article is general information and does not consider the circumstances of any investor.