Businessweek predicted the ‘death of equities’ in a 1979 cover story. It highlighted how some institutional investors replaced stock allocations with nontraditional investments such as precious metals, fine art and even Pizza Hut franchises after a decade of lacklustre returns. While the story might seem provocative now, there was little love for the stock market in the 1970s. Stocks were hurt by runaway inflation, skyrocketing oil prices and persistently low returns, among other factors.
We’re seeing similar sentiment in today’s markets, but instead of disliking stocks, investors are turning away from traditional active management. More than a few prognosticators have predicted the end of active, suggesting that bottom-up fundamental security selection in particular is antiquated, overpriced and ineffective.
We believe the prevailing sentiment is wrong and that cyclical – not secular – market conditions have favoured passive approaches in recent history.
Everyone gets a trophy in these markets
Since US equities bottomed in March 2009, the S&P 500 Index returned 371% cumulatively by the end of 2017, generating strong returns for investors with passive exposure (source: Morningstar, March 2009–December 2017.) The average bull market has lasted five years, but this one is in its ninth year and there are no imminent signs that it is ending.
While a boon for passive, this bull market has been troublesome for active managers. Headwinds for active management include low volatility and price dispersion. In recent years, the market has not generally differentiated between high-quality and low-quality names. Stock prices have generally risen regardless of a company’s earnings or quality. The market has been handing out participation trophies and companies have been rewarded simply for showing up.
We can see this clearly over the five-year period ended 31 December 2016. Historically, high-quality stocks have outperformed low-quality stocks, but over this time, high-quality and low-quality largely moved in lockstep, as shown in Chart 1.
Chart 1: Little distinction between companies with positive or negative earnings
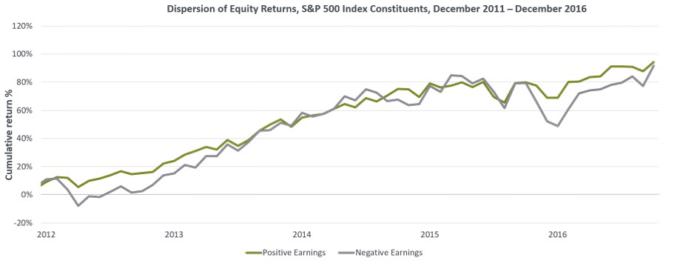
Source: Compustat earnings per share (EPS) data, December 2011–December 2016 for the S&P 500 Index. Each portfolio of positive and negative earnings companies is rebalanced monthly and market-cap weighted. Data labels are cumulative returns, as of December 2016.
Earnings are an essential ingredient for favourable stock prices. Investors should expect the stocks of companies with positive earnings to outperform those with negative earnings over time. There was less separation between the negative earners and positive earners which is why the passive approach outperformed. It didn’t matter what was owned because just owning ‘the market’ via a passive vehicle provided strong returns. While a bear market could help produce more investment opportunities for active strategies, it’s not a downturn, but rather a full market cycle that allows active managers to succeed. For example, the dispersion of stock prices — when driven by company fundamentals such as growth, profitability and cash flow — is an essential ingredient for traditional active managers.
Misalignment between investors and their managers
This passive phenomenon has created a misalignment between investors and their asset managers, which could cause investors to forfeit the full value of active management. The disconnect is most evident through mismatched investment time horizons, where investors expecting alpha over increasingly short time periods don't invest through a full market cycle, leaving alpha on the table.
(Alpha is a measure of the portfolio's risk-adjusted performance. When compared to the portfolio's beta, a positive alpha indicates a better than index performance. Beta is a measure of the volatility of a portfolio relative to the overall market. A beta less than 1.0 indicates lower risk than the market).
In our 2016 investor sentiment survey, most institutional investors acknowledged that full market cycles last seven or more years but most wouldn’t wait that long for performance to turn around. At least 70% of the investors would only tolerate underperformance for three years or less. (Source: 2016 MFS Active Management Sentiment Study: Global Insights. The global sample totaled 845 respondents, with 500 financial advisors, 220 institutional investors and 125 professional buyers responsible for the management of investments).
Since active conditions change through a full market cycle, making portfolio changes in as little as three years can lead either to missed opportunities or a failure to let the best insights from a manager mature and pay off.
We believe alpha opportunities are cyclical in nature, and that skilled active managers aligned with the long-term interests of their clients are best-positioned to capture those opportunities over time. A skilled active manager is one who demonstrates conviction through low portfolio turnover and high active share, is capable of adding value in volatile markets, integrates research and rewards collaborative thinking.
Correcting the misalignment by helping investors define long-term objectives and more effectively assess and measure active skill could result in better investment outcomes. (Source: 2015 Holding Horizon: A New Measure of Active Investment Management. Short-horizon funds, on average, hold stocks for 1.91 years, whereas long-horizon funds hold stocks for 6.85 years.)
Creative destruction and signs that dispersion has increased
Market breadth, or stock price dispersion, is a cyclical factor that ebbs and flows over time. Dispersion increased in 2017, as shown in Chart 2, improving conditions for active managers. Investors are beginning to differentiate between high- and low-quality stocks in some pockets. Some of the rising dispersion is likely related to a recent acceleration of digitization, creative destruction (i.e., innovation) and the collapse of intellectual property.
Chart 2: Dispersion continued to historical norms in 2017
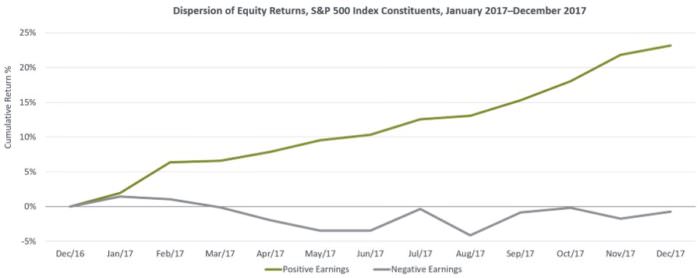
Source: Compustat earnings per share (EPS) data, January 2017–December 2017, for the S&P 500 Index. Each portfolio of positive and negative earnings companies is rebalanced monthly and market-cap weighted. Data labels are cumulative returns, as of December 2017.
While electronic platforms and widespread digitization are destroying intellectual property, the massive inflows into passive investment strategies signal that many investors believe that markets are structurally efficient and that alpha is permanently, not cyclically, elusive. We don’t think that anything in life, much less the markets, is linear. We believe future cash flows will migrate to the new owners of intellectual property. Margins, growth and profits will shift from incumbents to different entities. This is creating multiple alpha levers for active managers. It’s not just about spotting the innovators and disruptors, but also avoiding the over-earners that have peaked and are at risk of margin erosion.
Active management is waiting out a cycle
The ‘death of active’ narrative is misguided, just as the death of equities was in 1979. Investment alpha, like the markets, is cyclical, which is why it is prudent to be patient and wait for a thesis to bear fruit. Markets tend to be irrational over short periods and prices can overreact to irrelevant factors such as elections and the weather. These events typically have little material impact on a company’s fundamentals or long-term growth prospects. Eventually, at some point in a cycle, prices reflect the things that really matter — a company’s growth, cash flow and earnings.
Michael Roberge is Chief Executive Officer and Chief Investment Officer at MFS Investment Management. The comments, opinions and analysis are for general information purposes only and is not investment advice or a complete analysis of every material fact regarding any investment. This article is issued in Australia by MFS International Australia Pty Ltd (ABN 68 607 579 537, AFSL 485343), a sponsor of Cuffelinks.