The growth of Exchange Traded Funds (ETFs) has been one of the greatest global investment success stories of the past decade. In Australia, the increase in appetite for ETFs is reflected in the surge of listings with 179 ETFs available in 2018, up from 30 in 2010. However, little attention has been paid to the risks in some ETFs for investors.
While ETFs provide easy access to market segments and low-cost asset allocation tools showcasing a wide range of strategies, Zenith believes investors need to pay attention to potential red flags on the longevity of individual ETFs before investing.
Growth and diversification
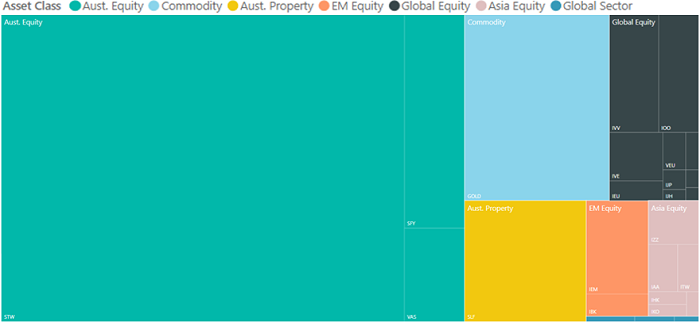
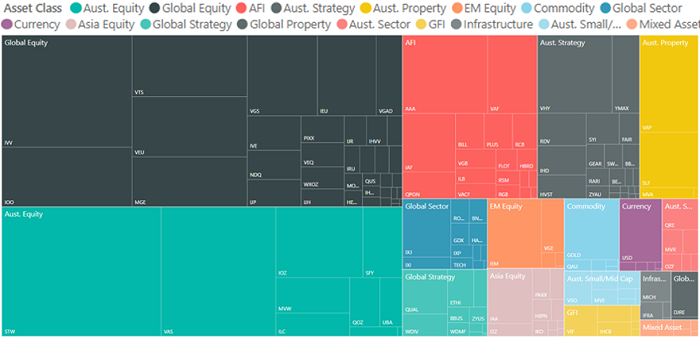
Industry competition has developed rapidly. The following charts show how the market has expanded since 2011, with a material increase in the number of ETFs and range of market segments (depicted according to size).
June 2011
Click to enlarge
June 2018
Click to enlarge
Expanded availability of options is broadly a positive. However, this shouldn’t mask the risks associated with some ETFs that struggle to gain acceptance and achieve scale.
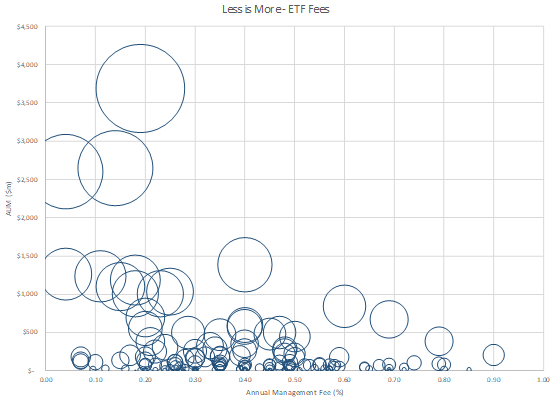
Investors are becoming increasingly sensitive to costs. Trends both locally and globally show that ETFs which act as low cost, core building blocks gain the greatest traction. The following chart shows all ETFs on the ASX measured by size and annual management fees (ex ‘Active’ products). Data points are unlabelled as this is less about ‘who’s winning’ than the broader themes.
Click to enlarge
There is clearly a relationship between fees and Assets Under Management (AUM). Over time, as ETFs reduce fees, they typically accelerate AUM. Leaders across the asset classes are generally first quartile for cost competitiveness, although there are some newer, cheaper ETFs which have not had time to build scale.
Achieving scale
Common denominators in ETFs which achieve material scale are:
- Competitive fees relative to peers
- Core market exposures
- Relative attractiveness of a strategy within a peer group
- First mover advantage
- Issuer business model, including scale, product diversity and marketing effectiveness.
While strong performance can drive short term growth, it typically lacks persistence as a factor.
As AUM rises, management can potentially reduce expense ratios as efficiencies increase. This can promote a positive feedback loop, where an ETF gains AUM, increases efficiency, lowers costs and gains yet more AUM. Cost competitiveness between products means investors reap the rewards as expense ratios fall.
While core ETFs have benefitted, the same cannot always be said for some niche products. ETF’s key attraction is the ability to bring asset allocation tools within reach of the average investor.
But specialisation can have drawbacks. The pool of investors to which specialised ETFs appeal may be shallower, and while fees tend to be higher, lack of scale can limit issuer profits. While their investment premise can be valid, a specialised ETF has a higher business-viability threshold.
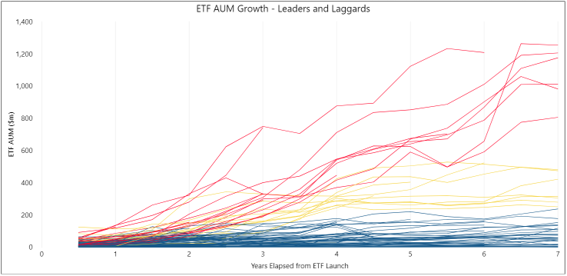
The following chart shows growth in market capitalisation for individual ETFs, measured in six-monthly intervals for the first seven years from listing.
Click to enlarge
There is a recognisable separation between ‘leaders’ and ‘laggards’. Occupying the middle ground are the ‘moderates’, those ETFs although successful, have failed to attain the momentum of the leaders.
Leaders are typically distinguished by cost effectiveness and core exposures. Obviously, cost is not the only thing that matters, however, it is clearly a dominant factor in investor preference.
The laggards face the risk that they fail to benefit from increased efficiencies enabled by growth, which in turn can result in stagnation and in some cases, delisting. We believe that there is a danger zone for ETFs failing to exceed $100 million in their first three to five years of operation.
Negative attributes inhibiting ETFs from achieving scale reflect success factors:
- Uncompetitive fees relative to peers
- Highly specialised exposures
- Complex investment thesis
- Issuer businesses lacking scale, product diversity and marketing effectiveness.
Since 2010, 17 ETFs have been delisted, mainly due to increased competition and poor performance which have contributed to lack of investor take-up. While only equating to approximately 1% per annum (by number), Zenith believes the rate of terminations will increase. By comparison, in the more mature market of the US, ETF delistings have averaged approximately 7% per annum over the last decade.
Consequences of a delisting
Small scale and poor market performance over a multi-year period can be leading indicators for delisting. Closure of a product has two main primary effects on advisers and their clients.
First, there is a potential sequencing issue. Delistings sometimes occur after prolonged negative performance. Over two-thirds of all delisted ETFs delivered negative total returns over one, two and three years prior to their delisting date. The following chart shows the median and average per annum net return across these ETFs prior to delisting.
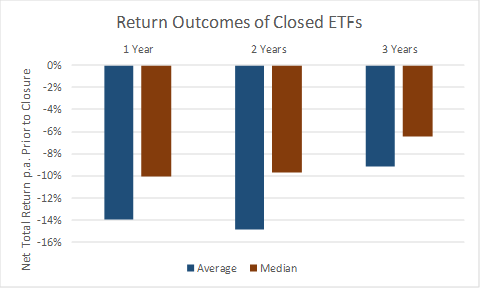
On delisting, investors are generally forced to exit and therefore crystallise a tax event. Naturally, there is the risk that for some, the timing can be far from ideal. The delisting of an ETF removes investor choice as to whether or not to maintain market exposure.
Second, the process of changing an exposure can be time-consuming for both advisers and clients. Depending on the arrangement, there may need to be discussions and a Record of Advice or new Statement of Advice issued. There may also be implications around sourcing a suitable replacement, particularly for more specialised ETFs.
Of course, not all small-scale ETFs risk closure and other factors may provide ongoing support at the issuer level. Some issuers will maintain certain niche ETFs for strategic reasons, as the ETF is part of a broad product offering from a stable business.
Obviously, terminations are not limited to ETFs and are also common in managed funds. However, Zenith believes that strong growth in issuance increases product competition. As a result, we believe that more products will be rationalised in the future, and investors should consider the implications of an ETF's lifecycle and the quality of the issuer, not just the investment merit.
Dugald Higgins is Head of Property and Listed Strategies at Zenith Investment Partners. This article is general information and does not consider the circumstances of any individual.