Register For Our Mailing List

Register to receive our free weekly newsletter including editorials.

Home / 407

Why don't higher prices translate into inflation? Blame hedonism

We’ve been hearing non-stop news this year about supply-chain disruptions, reduced supply and higher input costs as part of manufacturing and agriculture.

We’ve seen this first-hand through higher prices of wheat, corn, barley, oil, timber, iron, copper, bitumen, houses, cat food etc., and yet we’ve only seen muted inflation data thus far, as measured by Consumer Price Indexes (CPI).

This has made us a little sceptical. Corporate revenue has been affected by higher costs and we’re seeing higher costs of goods in stores and in futures markets, so why haven’t we seen the higher prices reflected in CPI?

Enter hedonism, the seeking of pleasure

Hedonism refers to behaviours and interactions that are pleasure seeking, where a being will seek pleasure with respect to pain.

Hedonic adjustments are utilised by economists and statisticians to measure the pleasure or utility, to derive pleasure-adjusted or utility-adjusted economic data.

Statistics bureaus use hedonic adjustments when calculating CPI, where CPI is conventionally used to measure inflation – general increases in the prices of goods and services.

Sounds strange doesn’t it?

We commonly use CPI to measure inflation, but we aren’t measuring raw price changes – we’re measuring the pleasure-adjusted or utility-adjusted price changes, which can be vastly different.

In fact, the result over the past 30 years has been a massive differential between real price movements and hedonic-adjusted price movements.

This should enrage anyone who receives a defined benefit payment, or anyone working in industries under collective bargaining agreements that increase wages in line with CPI, rather than real-world inflation.

A hedonic adjustment example

You have a bag of M&Ms that contains 100 little chocolates and costs $1 per packet.

Mars Inc. (the producer of M&Ms) finds a way to fill each bag with 110 M&Ms and raises the price to $1.10 per packet.

Using a hedonic adjustment, we would adjust the $1.10 bag back down to $1.00, as each M&M only costs 1c each. Therefore, cost of living has gone up by 10% ($1.00 to $1.10), but the hedonic-adjusted price has not changed ($1.00 to $1.00).

Hedonics in practice

Looking at how statistics bureaus use hedonic quality adjustments, it’s obvious they track some sort of quality or total utility metric, over time, with varying assumptions.

This is the only way that they can realistically account for car prices going sideways, or state that TV prices have declined 80%, when in raw price terms, prices are generally higher.
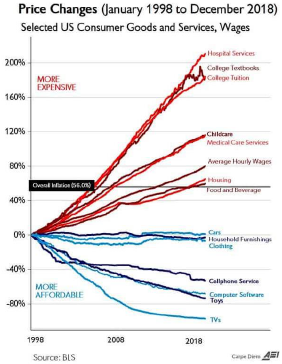
Source: US Bureau of Labour Statistics (BLS), BLS and American Enterprise Institution (AEI)

Take for example the price of a standard 1990 Honda Accord, that cost US$12,000 at the time, where the 2020 version costs US$25,000 now.

Sources: LHS image; Wikipedia // RHS image; carshowroom.com

Or for another example is a Ford Mustang, which cost US$9,000 in 1990, or US$27,000 now.

Sources: LHS image; Fordauthority.com // RHS image; carthrottle.com

Now, a non-statistician would simply derive the price differential between the two to calculate the price rise, i.e. Honda Accord price has increased 208%; Ford Mustang price has increased 300%.

However, that type of analysis would not pass at a statistics bureau, where they would adjust the price lower, to account for the increased utility (or pleasure) that the 2020 model has compared to the 1990 version.

This is a complex equation based on assumptions of utility regarding GPS, ABS, better fuel consumption, computer assist etc. For the mathematically-minded amongst us, hypothetical models for car prices would look like this:

Raw-price change:

Log(price) = Beta1 + B2(2020 model price) – B3(1990 model price)

Hedonic-adjusted price change:

Log(price) = Beta1 + B2(2020 model price) – B3(1990 model price) + B4(GPS) + B5(computer assist steering) + B6(fuel consumption) + B7(engine capacity) + B8(trunk capacity) + e

The hedonic-adjusted price has a lot of assumptions underpinning the price change, which may not hold in reality, depending on the different car manufacturers and models.

As such, the US Bureau of Labour Statistics (BLS) records that US new vehicle prices have gone sideways these last 30 years (red line), rather than up 200-300% (green line).
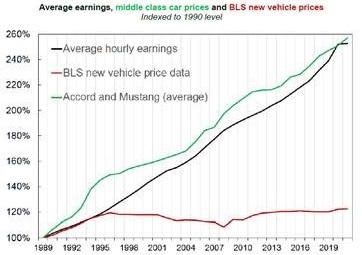
Source: BLS, HSBC

Not a cost of living index

This is why CPI no longer reflects costs of living as measured by consumer spending. It reflects the cost-adjusted price based on the utility or pleasure we receive from advances in technology.

This may be seen as a BETTER measure for our economic prosperity, but it doesn’t help any consumer when central banks look at inflation data at ‘low’ levels of 0-2%, when really the nominal figure is far higher.

Alternative measures of inflation

The failings of CPI have been well known for decades already, where the problem isn’t the methodology, but how we use it.

CPI isn’t broken – it fairly accurately measures utility-adjusted changes in prices. But what we shouldn’t be doing is using CPI to benchmark wages and salaries or superannuation benefits.

This has given rise to other measurements, which are slowly gaining alternative popularity. A favourite of mine is called PriceStats, which collects daily online price data on over 5 million different products sold by hundreds of retailers across more than 70 countries.

This data mainly covers goods including food and beverages, clothing, energy, healthcare, real estate, furniture and electronics – the vast majority of household expenses.

The RBA has looked at the methodology before, which they noted includes ‘volatile’ items such as food and energy.

This is laughable, as why would we ignore key components of household spending such as food and energy, simply because they’re volatile? These items and their corresponding prices are a key part of life for the majority of the world.

Below is PriceStats measure of Australian inflation (orange) versus the ABS Consumer Price Index (blue).
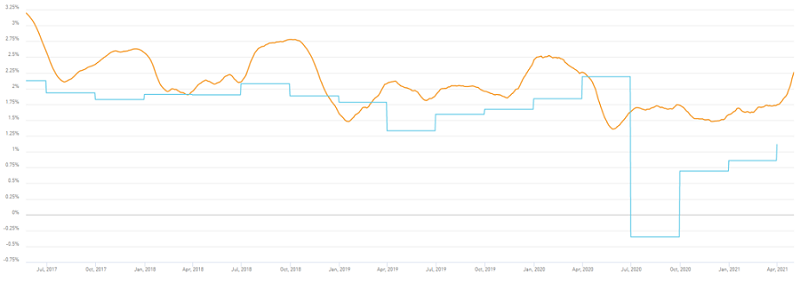
Source: Pricestats, State Street

You may notice that PriceStats’ measurements consistently reflect higher inflation than CPI, over the past five years. By PriceStats’ gauge, Australian inflation is already well within the RBA’s 2-3% target band, whereas by CPI, we’re languishing well below at 1%.

And if we make the same comparison in the USA, PriceStats is more closely related to BLS CPI, though has already tracked higher in 2021 where there is a growing disparity.

It’s worth remembering that PriceStats takes daily measurements of inflation, which are released three days later, whereas the ABS records inflation quarterly, which is released nearly two months after the end of the relevant period. i.e. Q1 2021 (Jan-Mar) inflation data was released in late April 2021.

This is why PriceStats is suitable for central banks to measure ongoing inflation, lest they be caught well behind the inflation curve, which seems to be happening in the US already.
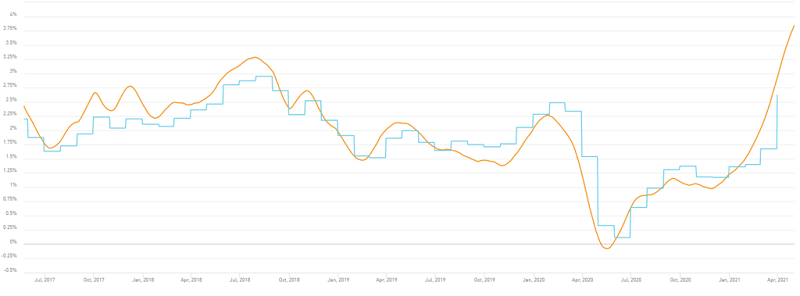
Source: Pricestats, State Street

Preservation of genuine purchasing power

As investors, an erosion of our purchasing power is the antithesis of our goals. We seek to preserve the value of capital, and where possible and applicable, increase the value of said capital.

The under-measurement of CPI is reason enough to be aware of inflation impacts that increase costs of living, where if there is not a subsequent appreciation in financial asset prices, our purchasing power may be eroded.

This is the reason why we seek investments for our clients that have a direct relation to higher real-world prices, such as inflation-linked bonds, timber, precious metals and soft commodities. 


Jesse Imer is a Fixed Income Investment Strategist at Mason Stevens. The views expressed in this article are those of the author and are subject to change. Mason Stevens is only providing general information only. You should consider this information, along with all your other investments and strategies when assessing the appropriateness of the information to your individual circumstances.


6 Comments
Bakker
May 15, 2021

For me the real test of inflation is how it effects my annual cost of living. While this can be subjective for each person, you can apply any type of formula you like, the test is “ how much extra am I paying for the same service/ goods compared to last period.”.
In the real world the example of the Mars M&Ms is that they reduce the quantity ( or weight) but not the price..Just visit any supermarket for more examples.
Also ,when manufacturers increase prices the supply chain percentage margins multiply along the chain to finally the end purchaser and unless you have a input tax claw back , you cope the loading all along the way. So for me the CPI measurement in AUS.nothing but a great con.

Karun
May 14, 2021

I see the CPI as a measurement which govts. and economists create to work with their models of the economy. They do not reflect reality which may explain economist models can show any result you want.
When one buys goods and services, one one can only buy what is available at that time. The cost of replacement does not reflect the fact, you cannot replace exactly what you are replacing as it is no available in the market. Just because it is is an improved version does not mean you are getting something cheaper. The CPI does not reflect the fact you cannot buy exactly the same goods and services as you could 1or 2 or 3 or more years ago. If it costs more to replace then cost of living has gone up.

Bob T
May 13, 2021

Regarding the Ford Mustang's price increase from $9000 to $27000 cited as a 300% increase, even the non-statistician can understand that a tripling of the price represents only a 200% increase.

Christian
May 12, 2021

It sounds like an exercise in pulling the wool over our eyes to justify keeping interest rates low.

Rob
May 12, 2021

The Market does not give a toss! Mr Mkt believes inflation is coming, higher interest rates are inevitable and debates on methodology are not going to change that view!

Warren Bird
May 12, 2021

An overstated case in several ways, resulting in the wrong conclusion.

1) the main reason that rising raw commodity prices haven't translated into a rising CPI is that raw commodities are only a small part of the inputs to the final goods and services that we buy. (Indeed, the commodity input component to services is very limited.) There are manufacturing costs (we don't eat raw wheat or wear raw wool), storage costs, transport costs, retail markups, etc all with other elements such as labour costs, interest expenses, etc. These other elements have not yet experienced the demand pull squeeze needed to rise significantly.

2) hedonistic adjustments are actually quite slow to come through. One of the reasons that the RBA targets the CPI at 2-3% and not 0% is because of the UPWARDS bias that slow hedonistic adjustments create in index calculations for the CPI.

Agree that the composition of the CPI basket is possibly not adjusted rapidly enough for new goods, but I'm not convinced that new good automatically reduce inflation. EG every Apple product comes on as a new good at a premium and the prices then decline over time. So it's as an existing good that they reduce inflation, not as a new good.

Every statistic ever produced needs to be properly understood and used for the purposes for which it's created. The CPI also suffers from short-term volatility unrelated to on-going price trends, hence the RBA also uses several measures of the 'underlying' CPI - trimmed means etc.

But contrary to the silly statement in this article that the RBA 'ignores' food, trimmed means adjust the CPI in a manner that doesn't preclude any particular goods or services. It simply trims off whatever was the highest and lowest price increases in a quarter to remove one-off outliers that may distort the figure away from trend.

This article does not convince me that the CPI is inappropriate for what it's being used for - either in its raw form used for a range of indexing adjustments over time and in its trimmed mean forms used to guide monetary policy.


Leave a Comment:

RELATED ARTICLES

This vital yet "forgotten" indicator of inflation holds good news

CPI may understate the rising costs of retirement

Protecting retirement income from inflation shocks

banner

Most viewed in recent weeks

Vale Graham Hand

It’s with heavy hearts that we announce Firstlinks’ co-founder and former Managing Editor, Graham Hand, has died aged 66. Graham was a legendary figure in the finance industry and here are three tributes to him.

Australian stocks will crush housing over the next decade, one year on

Last year, I wrote an article suggesting returns from ASX stocks would trample those from housing over the next decade. One year later, this is an update on how that forecast is going and what's changed since.

Avoiding wealth transfer pitfalls

Australia is in the early throes of an intergenerational wealth transfer worth an estimated $3.5 trillion. Here's a case study highlighting some of the challenges with transferring wealth between generations.

Taxpayers betrayed by Future Fund debacle

The Future Fund's original purpose was to meet the unfunded liabilities of Commonwealth defined benefit schemes. These liabilities have ballooned to an estimated $290 billion and taxpayers continue to be treated like fools.

Australia’s shameful super gap

ASFA provides a key guide for how much you will need to live on in retirement. Unfortunately it has many deficiencies, and the averages don't tell the full story of the growing gender superannuation gap.

Looking beyond banks for dividend income

The Big Four banks have had an extraordinary run and it’s left income investors with a conundrum: to stick with them even though they now offer relatively low dividend yields and limited growth prospects or to look elsewhere.

Latest Updates

Investment strategies

9 lessons from 2024

Key lessons include expensive stocks can always get more expensive, Bitcoin is our tulip mania, follow the smart money, the young are coming with pitchforks on housing, and the importance of staying invested.

Investment strategies

Time to announce the X-factor for 2024

What is the X-factor - the largely unexpected influence that wasn’t thought about when the year began but came from left field to have powerful effects on investment returns - for 2024? It's time to select the winner.

Shares

Australian shares struggle as 2020s reach halfway point

It’s halfway through the 2020s decade and time to get a scorecheck on the Australian stock market. The picture isn't pretty as Aussie shares are having a below-average decade so far, though history shows that all is not lost.

Shares

Is FOMO overruling investment basics?

Four years ago, we introduced our 'bubbles' chart to show how the market had become concentrated in one type of stock and one view of the future. This looks at what, if anything, has changed, and what it means for investors.

Shares

Is Medibank Private a bargain?

Regulatory tensions have weighed on Medibank's share price though it's unlikely that the government will step in and prop up private hospitals. This creates an opportunity to invest in Australia’s largest health insurer.

Shares

Negative correlations, positive allocations

A nascent theme today is that the inverse correlation between bonds and stocks has returned as inflation and economic growth moderate. This broadens the potential for risk-adjusted returns in multi-asset portfolios.

Retirement

The secret to a good retirement

An Australian anthropologist studying Japanese seniors has come to a counter-intuitive conclusion to what makes for a great retirement: she suggests the seeds may be found in how we approach our working years.

Sponsors

Alliances

© 2024 Morningstar, Inc. All rights reserved.

Disclaimer
The data, research and opinions provided here are for information purposes; are not an offer to buy or sell a security; and are not warranted to be correct, complete or accurate. Morningstar, its affiliates, and third-party content providers are not responsible for any investment decisions, damages or losses resulting from, or related to, the data and analyses or their use. To the extent any content is general advice, it has been prepared for clients of Morningstar Australasia Pty Ltd (ABN: 95 090 665 544, AFSL: 240892), without reference to your financial objectives, situation or needs. For more information refer to our Financial Services Guide. You should consider the advice in light of these matters and if applicable, the relevant Product Disclosure Statement before making any decision to invest. Past performance does not necessarily indicate a financial product’s future performance. To obtain advice tailored to your situation, contact a professional financial adviser. Articles are current as at date of publication.
This website contains information and opinions provided by third parties. Inclusion of this information does not necessarily represent Morningstar’s positions, strategies or opinions and should not be considered an endorsement by Morningstar.