According to Morningstar, 74% of U.S. large cap blend managers underperformed the S&P 500 last year. And it wasn’t just a single bad year. The decade ending in 2023 saw a stunning 90.2% of U.S. large cap blend managers underperform their benchmarks. After a brief respite for active managers in 2022, when 53% of U.S. large cap blend managers outperformed, it seems as if 2023 may be the last straw for many clients. How can you blame them? A decade is a lifetime in the investment world. If 90.2% of managers underperformed their benchmarks in U.S. large caps over the last decade, surely that is irrefutable evidence that the market is efficient?
The reality is somewhat different, however. As we will see, the reason why the S&P 500 and other U.S. large cap equity benchmarks have been close to impossible to beat over the last year and almost as hard to beat over the last decade stems from the nature of the stocks that have outperformed.
The U.S. equity market has been growing steadily more concentrated. When the very largest stocks are the best performing ones, it is an extremely difficult environment for active managers to keep up with, let alone outperform. To outperform an index, it is necessary to look different from it. We tend to think of that difference in terms of the stocks that a manager owns, but as Cremers and Petajisto’s active share measure points out, what managers choose not to own is just as important as what they do own.
In order to make space in a portfolio for the stocks a manager wants to be overweight, they by necessity must have an equal and offsetting underweight in other stocks. While active share envisions this as running a long/short portfolio on top of the benchmark, the reality is that it is a highly constrained long/short. A manager can choose to be as overweight as they would like in their favourite stocks, but the underweights for a long-only manager are constrained by the weights of those stocks in the benchmark.1 The biggest underweight for a manager will not be their least favourite stock, but the largest stock in the benchmark that they don’t like enough to have a substantial weight in. The upshot is that long-only active managers almost always have substantial bias against the very largest stocks in their benchmarks.
This is particularly true of the extremely high active share 'high conviction' managers beloved by endowments and foundations, who commonly have active shares in the 95% range. [If a manager has only 5% overlap with their benchmark, they definitionally have large underweights in either all or almost all stocks that have a large weight in the benchmark.] For most of history, biasing portfolios against the very largest stocks has been lucrative. But over the last decade, and particularly the last year, it has been a disaster.
A narrow decade
If you look at the 10 largest companies in the S&P 500 (or any capitalization-weighted index, for that matter), odds are that the stocks of those companies meaningfully outperformed the broad market over the preceding decade. The largest companies in the world either started out large and kept up with their competition, or they started out small and outperformed most everyone who was larger. This was certainly the case over the last decade.
On a forward-looking basis, however, big is generally anything but beautiful. Exhibit 1 shows the relative return of the 10 largest stocks in the S&P 500 in the year following that ranking.
Exhibit 1: Top 10 stocks vs. S&P 500
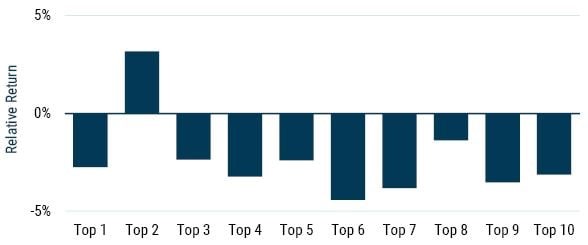
Data from 1957-2023 | Source: Compustat, Standard & Poors.
Nine of the top 10 have underperformed on average. [This isn’t to say that investing in the second largest company in the index is a good idea. Prior to 2013 the second largest stock was in the throes of a 20-year drawdown relative to the S&P 500.] The historical underperformance of the top 10 comes down to the two main sources of return – valuation expansion and fundamental growth – being harder to achieve than for your average company.
The largest stocks generally become the largest by way of becoming expensive, and this anti-value tilt has historically been quite costly, explaining most of these companies’ poor relative returns. [We can see this from a regression of returns on four important factors: market, size, value, and quality. The top seven have historically underperformed what we would expect given these characteristics.] Good returns in the face of high valuations, moreover, require exceptional earnings growth. When a company already has a substantial market and profit share of the industries in which it operates, unusual growth tends to be significantly harder than normal. It can be particularly hard if the company’s growth catches the attention of anti-trust regulators.
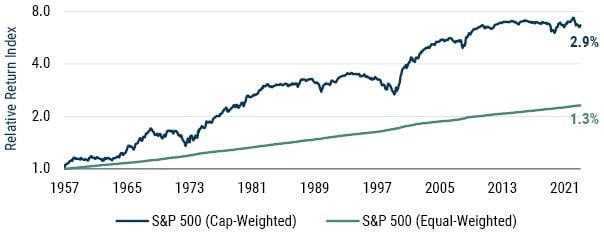
The largest stocks certainly don’t underperform all of the time, but on average, they have substantially trailed the average S&P 500 stock, as we can see in Exhibit 2.
Exhibit 2: S&P500 – Top 10 vs. 490 equal-weighted
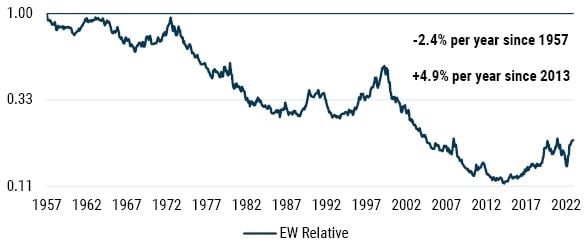
Data from 1957-2023 | Source: Compustat, Standard & Poors
Since 1957, the 10 largest stocks in the S&P 500 have underperformed an equal-weighted index of the remaining 490 stocks by 2.4% per year. But the last decade has been a very notable departure from that trend, with the largest 10 outperforming by a massive 4.9% per year on average.
Magnificent and concentrated
The break in the consistent downward trend of cap-weighted underperformance reflects the magnificence of the Magnificent Seven: Apple, Microsoft, Alphabet, Amazon, Nvidia, Meta, and Tesla. As far as mega caps go, they have been practically unparalleled in their outperformance. They strung together a series of market-beating performances over the last 10 years, with 2022 being the single year in which they didn’t beat the market. In 2023, as their monicker became part of the common lexicon, they outperformed the S&P 500 by an almost unimaginable 60%.
Exhibit 3: The Magnificent 7 vs. the S&P 500
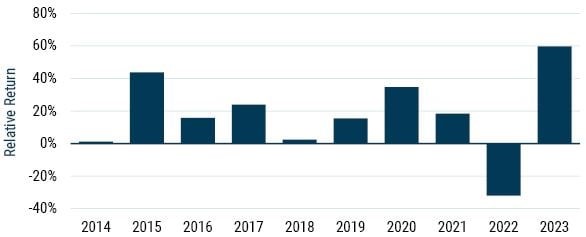
Data from 2014-2023 | Source: Compustat, Standard & Poors
This performance came in part from the unusual cheapness of mega caps at the start of the decade. Apple, Microsoft, and Google, for instance, boasted a combined price-to-earnings (P/E) ratio of 15x in 2013, while the market’s P/E was about 25% higher. A simple reversal of this trend was a lovely tailwind (although much more than a reversal occurred). These companies, alongside their similarly magnificent brethren, also managed to grow earnings at a breakneck pace. Microsoft and Amazon did so by reinventing themselves. Apple, Alphabet, Meta, Nvidia, and Tesla took over their primary industries. The medium-sized businesses among them became huge, and the large ones became giants.
The continued, unrelenting outperformance of very large companies has led to the S&P 500 becoming significantly more concentrated over the decade. The top seven names in the index comprise 28%, up from 13% a decade earlier. The S&P 500’s total concentration, which we can measure using a Herfindahl-Hirschman Index (or HHI), is equivalent today to that of an equal-weighted, 59-stock portfolio. Ten years ago, the index was more than twice as diversified. We have never seen – over any 10-year period – a decline (or increase) in diversification of the magnitude we have just witnessed.
Exhibit 4: Effective # of names (1/HHI) in the S&P 500
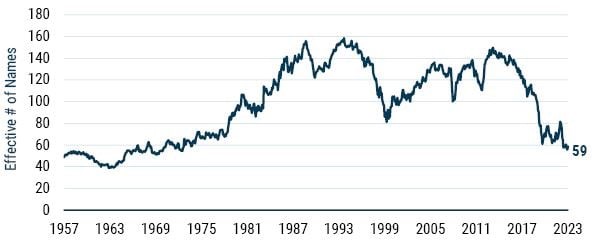
Data from 1957-2023 | Source: Compustat, Standard & Poors
The active horror show
This extraordinary performance of the mega caps and the consequent concentration of the S&P 500 seems to have become conflated with markets becoming more efficient. This conflation occurs because over the same decade that appended ‘Magnificent’ to ‘Seven’, only 9.8% of U.S. large cap ‘core’ active managers (managers who skew neither toward value nor growth) outperformed their benchmarks. While these events are certainly connected, they in fact have very little bearing on market efficiency.
Because the vast majority of active managers are substantially underweight the largest stocks, periods when those stocks outperform are a serious headwind for active managers’ relative performance. If we contrast the equal-weighted vs. cap-weighted performance of the S&P 500 with the annual percentage of U.S. large cap core active managers outperforming their benchmark from 2014 to 2022 (according to Morningstar), we find that the correlation of these (admittedly short) two series is north of 50%.
While Morningstar has not yet published its results for the full year of 2023, the equal-weighted S&P 500 trailing its cap-weighted counterpart by 11.5% (the second worst showing of all time) suggests that investment committees will have their brows furrowed when reviewing their U.S. active equity portfolios’ performance vs. the S&P 500 over the last year. Some brow-unfurrowing might be merited. High active share managers have almost no chance in a year when the giants are dominating.
To show just how difficult an active manager following the concentrate-and-equal-weight strategy would have it, we simulate what a talented set of managers could have achieved versus the cap-weighted benchmark. These simulated managers have a consistent hit-rate of 53%; that is, each of their stock picks has a 53% chance of beating the average stock in the S&P 500 over the 12 months following their selection. This might not seem like a great deal of prescience, but it really is. This group of managers, by picking 20 stocks and equally weighting them, would have outperformed the S&P 500 by 3% per annum from 1957 to the end of 2023, generating cumulatively for their investors six times the return of the index. They would have beat the index two thirds of the time. Their worse performance as a group through 2023 would have yielded them a relative return of -13.6% in 1998 (a year so horrible for most active investors that it is best suppressed). This is a pretty exceptional return profile.
Exhibit 5: Oracle managers vs. S&P 500
Source: GMO, Standard & Poors
The 10 years ending in 2023 were less kind to our oracular stock pickers. Despite exceptional relative returns of 8% in 2022, the group still lost to the S&P 500 by 30 bps per annum (before fees!). In 2023, only 7% of our simulated skilled managers would have beat the cap-weighted index. An investment committee that sought out fundamental managers that roughly follow our described investment process is then exceedingly unlikely to have seen its listed equity bucket shoot the lights out, and it should be comfortable with that. The reality is that these managers still had strong performance against the equal-weighted S&P 500 – and that is what they should be contrasted with in good times and in bad. If your fundamental active manager keeps lagging versus the equal-weighted S&P 500, that is suggestive of an issue; lagging the cap-weighted benchmark is, for such managers, generally uninformative.
Exhibit 6: 2023 Performance – oracle active managers
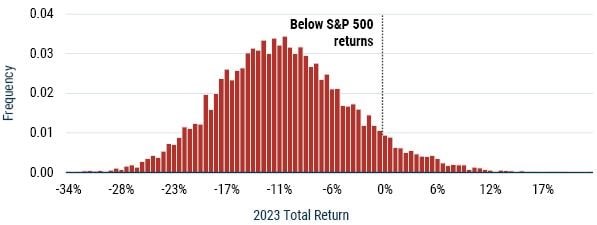
Source: GMO
1 A big part of the charm of long/short and equity extension strategies is that managers are freed from this constraint. Once zero ceases to be the lower bound of portfolio weights, a manager can scale their active positions according to their conviction, not a company’s size.
Ben Inker is co-head of GMO’s Asset Allocation team, a member of the GMO Board of Directors and a partner of the firm. John Pease is a member of GMO’s Asset Allocation team.
Disclaimer: The views expressed are the views of Ben Inker and John Pease through the period ending February 2024, and are subject to change at any time based on market and other conditions. This is not an offer or solicitation for the purchase or sale of any security and should not be construed as such. References to specific securities and issuers are for illustrative purposes only and are not intended to be, and should not be interpreted as, recommendations to purchase or sell such securities.
Copyright © 2024 by GMO LLC. All rights reserved.