Register For Our Mailing List

Register to receive our free weekly newsletter including editorials.

Home / 91

Long term equity returns and mean reversion

Baron Rothschild is credited with saying that "the time to buy is when there's blood in the streets." Implicit in this statement is that markets are mean reverting and periods of extreme negative returns are not likely to be sustained. Put simply, when everyone is selling it often represents an opportunity to achieve superior future returns.

Of course being a contrarian is not easy and goes against the natural bias of human behaviour. When returns are negative there is a natural bias to shy away from investing. But this is precisely the time to invest to achieve above average nominal returns. Conversely when markets are running hot everyone wants to be greedy.

In early 2012 Alan Kohler on the ABC News commented that the current recovery was the worst on record, including the crash of 1929, the inflation-induced recession of 1973 and the bubble of 1987, and used Chart 1 to demonstrate (which has been updated to October 2014). But markets do not stay pessimistic indefinitely (with some exceptions such as the Japanese market). Nor do markets stay “irrationally exuberant”, to quote Greenspan.

Chart 1: Market crashes and recoveries
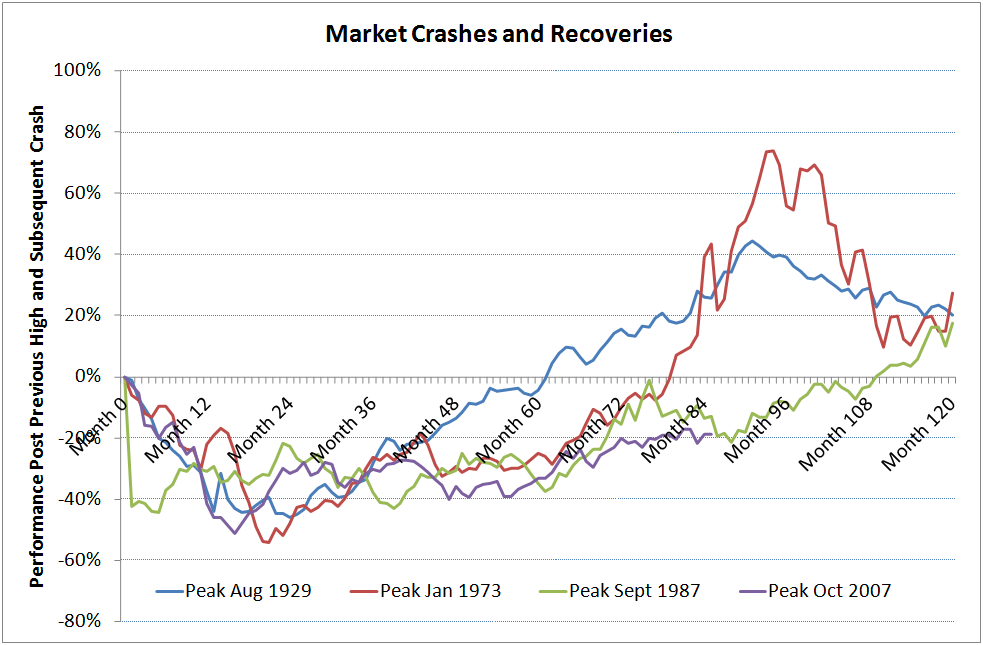
Source: Historical records based on monthly time series of the combined price history of the Sydney Stock Exchange and the Melbourne Stock Exchange from 1900 to 1970 and the ASX All Ordinaries Price Index from Dec 1970 to Oct 2014.

Chart 2: Australian equity market and length of bear markets

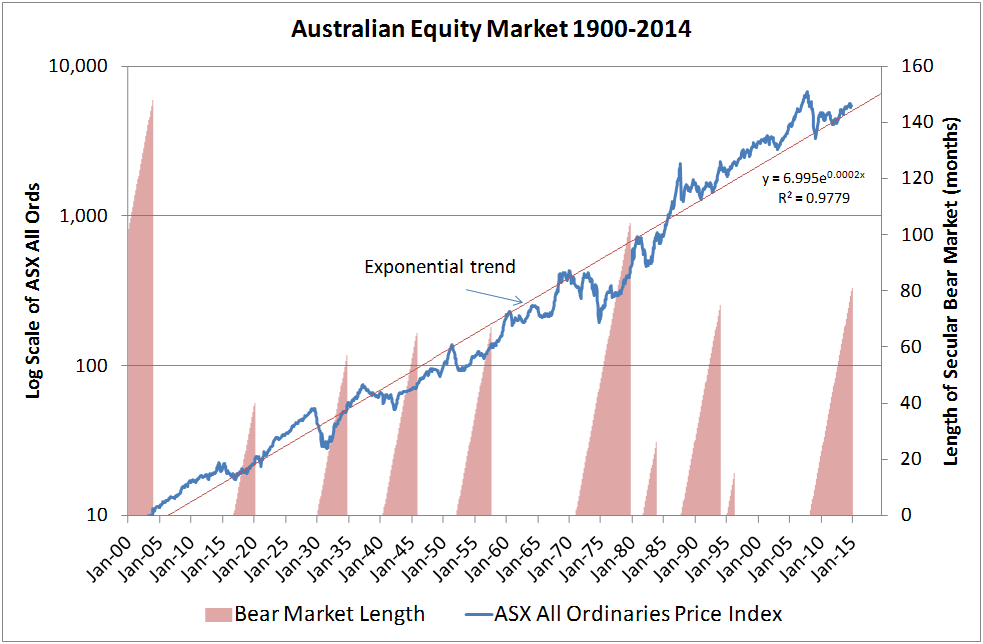
Bear market is measured as a 20% decline from the market high and lasts until previous high is surpassed.

Since 1900 the Australian equity market has returned 5.76% pa (geometric average, excluding dividends and before inflation, to end of October 2014). In the short term markets are random, but over the long term markets mean revert to the long term average.

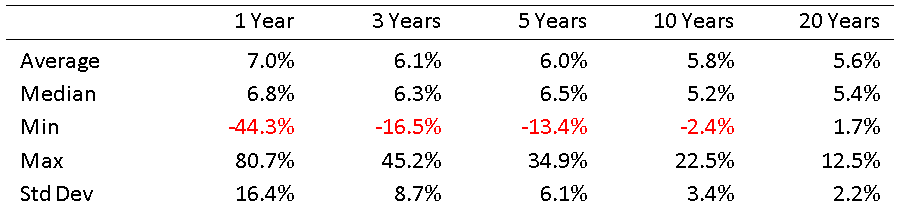
Table 1: Historical Returns 1900 to 2014
RS Table1 051214

The mean reversion of the Australian market can be illustrated by charting rolling five year returns (Chart 3). For simplicity standard deviation bands have been included around the long term mean of 5.76% pa. Some 68% of all returns will reside within a standard deviation of +1 and -1, and 95% of returns reside within a standard deviation of +2 and -2.

Chart 3: Rolling 5 year Australian market price index returns

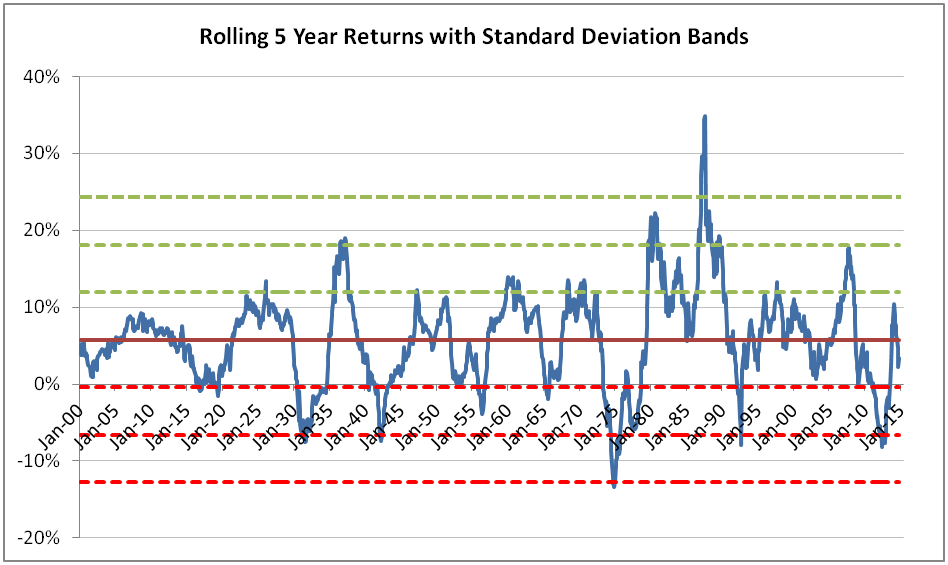
Importantly, returns significantly above or below the long term average are simply unsustainable.

The peak of 1987 was more than 4 standard deviations away from the long term mean. Statistically the chance of this occurring is 0.02%. The returns into 2007 were two standard scores above the mean. The crash of 1929, World War Two and the 1992 recession saw five year returns more than two standard deviations away from the mean and the inflation led recession of 1973 saw returns more than 3 standard deviations from the mean. Even May of 2012 saw five year returns almost two standard deviations away from the mean.

Table 2: Historical 5 Year Standard Deviations greater than +2

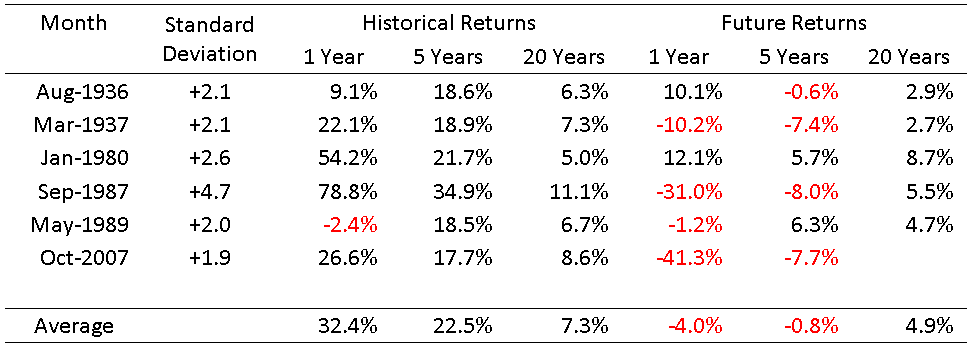
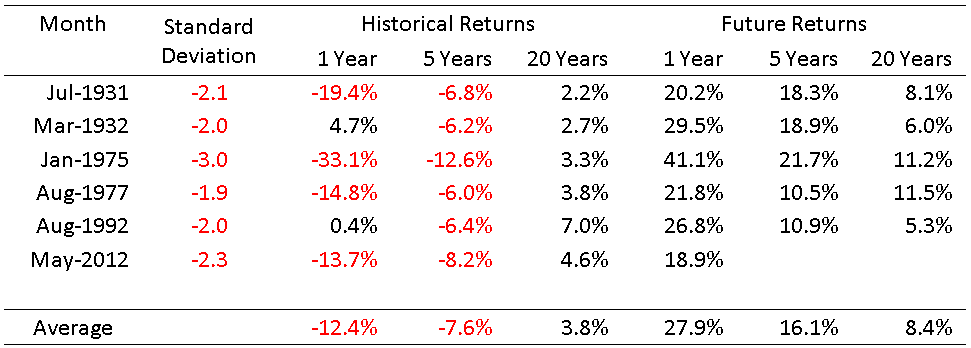
Table 3: Historical 5 Year Standard Deviations less than -2

Of course, not all companies recover from tough times. This analysis focusses on the broad market, but not all individual companies revert to a mean. Some disappear forever!

Tables 2 and 3 demonstrate that when historical returns reach positive/negative extremes, future returns have a high probability of being significantly less than/greater than the long term average. For example, in Table 2, where the market is more than two standard deviations above its long term mean, such that historical returns have been good, the future returns from that point have been poor. Conversely, in Table 3, where the market is below its long term mean, the future returns from that point have been good.

If history is a guide one would expect future returns from the low of May 2012 to be above the long term average. This does not mean the markets won’t be volatile as they never move in straight lines – and markets can remain subdued for periods much longer than expected (for example the Japanese stock market). But it can give one a glimpse of where the market may be headed.


Robert Stewart is a Director of Sandgreen Pty Ltd, former Head of Challenger Howard Mortgage Fund and Head of Index Funds at Colonial First State Global Asset Management. This article is for general information and is not personal financial advice. Readers should seek their own professional advice.


  •   5 December 2014
  • 2
  •      
  •   
2 Comments
Brian Salt
December 05, 2014

If markets are at all rational they will consider dividends, taxation (ie franking credits) and inflation. The above analysis excludes these so from an investors point of view how useful is it really?

Rob Stewart
January 27, 2015

Brian

Thanks for your comment. I make the following response:

* I deliberately selected the longest time period available where monthly data was accurate and sourced from SIRCA – which was limited to price index data. The All Ordinaries Accumulation series did not start until 1979 and I am yet to find a reliable data series that includes a total return prior to this date

* I have relied upon the inflation data from the Bureau of Statistics, which starts in 1948. I am yet to discover a longer series of monthly CPI data, although annual data appears to be available if one searches hard enough.

* Finally dividend imputation was only introduced in 1987 and I am yet to discover the franking component on monthly data for the All Ordinaries


Should you have accurate monthly data for total return, CPI and franking credits for longer periods, I would gladly accept this and update my own data.

FYI, if you look at a chart of the five year returns (real) for the All Ordinaries Accumulation Index from 1984, it does not diminish the crux of the article: that the Australian market is mean reverting around a longer term mean. Markets do not stay irrationally exuberant (for example 1987, and 2005 to 2007), and nor do they stay irrationally pessimistic (for example 1992 and 2012).


Leave a Comment:

RELATED ARTICLES

Lessons from Australia’s largest property busts

banner

Most viewed in recent weeks

Warren Buffett's final lesson

I’ve long seen Buffett as a flawed genius: a great investor though a man with shortcomings. With his final letter to Berkshire shareholders, I reflect on how my views of Buffett have changed and the legacy he leaves.

13 ways to save money on your tax - legally

Thoughtful tax planning is a cornerstone of successful investing. This highlights 13 legal ways that you can reduce tax, preserve capital, and enhance long-term wealth across super, property, and shares.

The housing market is heading into choppy waters

With rates on hold and housing demand strong, lenders are pushing boundaries. As risky products return, borrowers should be cautious and not let clever marketing cloud their judgment.

Why it’s time to ditch the retirement journey

Retirement isn’t a clean financial arc. Income shocks, health costs and family pressures hit at random, exposing the limits of age-based planning and the myth of a predictable “retirement journey".

Australia's retirement system works brilliantly for some - but not all

The superannuation system has succeeded brilliantly at what it was designed to do: accumulate wealth during working lives. The next challenge is meeting members’ diverse needs in retirement. 

Taking from the young, giving to the old

Despite soaring retiree wealth, public spending on older Australians continues to rise. The result: retirees now out-earn the young, exposing structural flaws in the tax system and challenges for fiscal sustainability.

Latest Updates

Investment strategies

Howard Marks: AI is "terrifying" for jobs, and maybe markets too

The renowned investor says there’s no shortage of speculative investors chasing AI riches and there could be a lot of money lost in the process. His biggest warning goes to workers and the jobs which will be replaced by AI.

Property

The 3 biggest residential property myths

I am a professional real estate investor who hears a lot of opinions rather than facts from so-called experts on the topic of property. Here are the largest myths when it comes to Australia’s biggest asset class.

Retirement

Australia's retirement system works brilliantly for some - but not all

The superannuation system has succeeded brilliantly at what it was designed to do: accumulate wealth during working lives. The next challenge is meeting members’ diverse needs in retirement. 

Retirement

Retirement affordability myths

Inflated retirement targets have driven people away from planning. This explores the gap between industry ideals and real savings, and why honest, achievable benchmarks matter. 

Retirement

Can you manage sequencing risk in retirement?

Sequencing risk can derail retirement, but you’re not powerless. Flexible withdrawals, investment choices and bucketing strategies can help retirees navigate unlucky markets and balance trade-offs.    

Retirement

Don’t rush to sell your home to fund aged care

Aged care rules have shifted. Selling the family home may no longer be the smartest option. This explains the capped means test, pension exemptions and new RAD exit fees reshaping the decision.

Shares

US market boom-bust cycles - where are we now?

This gives comprehensive data on more than 100 years of boom and bust cycles on the US stock market - how the market performed during these cycles, where the current AI uptick sits, and what the future may hold.

Property

A retail property niche offers a lot more upside

Retail real estate is outperforming as a cyclical upswing, robust demand and constrained supply drive renewed investor interest. This looks at the outlook and the continued rise of convenience assets. 

Sponsors

Alliances

© 2025 Morningstar, Inc. All rights reserved.

Disclaimer
The data, research and opinions provided here are for information purposes; are not an offer to buy or sell a security; and are not warranted to be correct, complete or accurate. Morningstar, its affiliates, and third-party content providers are not responsible for any investment decisions, damages or losses resulting from, or related to, the data and analyses or their use. To the extent any content is general advice, it has been prepared for clients of Morningstar Australasia Pty Ltd (ABN: 95 090 665 544, AFSL: 240892), without reference to your financial objectives, situation or needs. For more information refer to our Financial Services Guide. You should consider the advice in light of these matters and if applicable, the relevant Product Disclosure Statement before making any decision to invest. Past performance does not necessarily indicate a financial product’s future performance. To obtain advice tailored to your situation, contact a professional financial adviser. Articles are current as at date of publication.
This website contains information and opinions provided by third parties. Inclusion of this information does not necessarily represent Morningstar’s positions, strategies or opinions and should not be considered an endorsement by Morningstar.