The lesson from history is that passive exposure leads to concentrations in expensive areas just before those areas suffer. That is alarming if we consider how passive portfolios have evolved since the Global Financial Crisis.
In 2009, a passive investor in the MSCI World Index had a 50% exposure to the US, 1/3 of their portfolio in giant companies, and a 10% exposure to tech. Over the subsequent years, that portfolio has grown more American, more dominated by giants, and more tech heavy. Stockmarkets are now heavily concentrated in the US (70%), giant companies (2/3), and in technology shares (25%). The magnificent seven alone account for close to 20% of global passive portfolios.
Figure 1: Equity markets are concentrated in the US
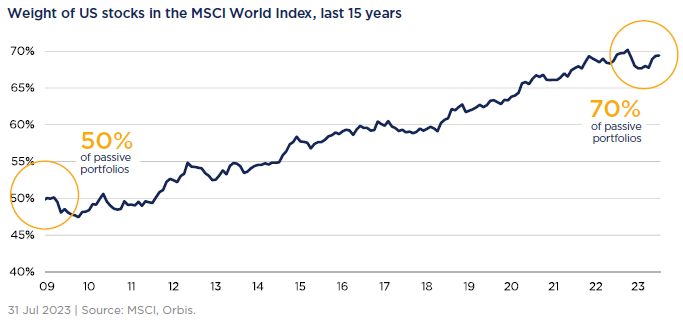
Figure 2: Equity markets are concentrated in giant companies
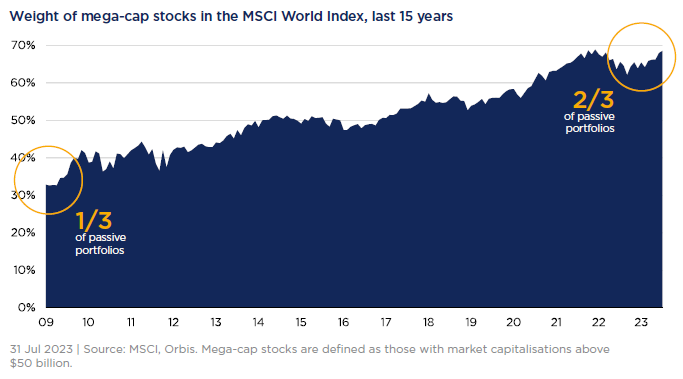
Figure 3: Equity markets are concentrated in tech shares
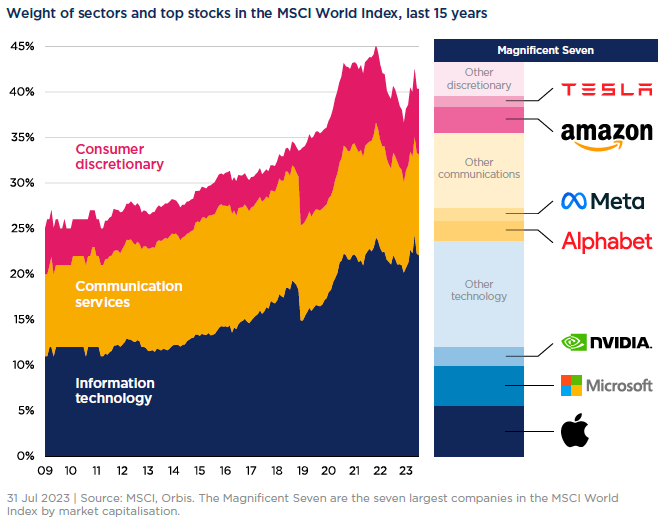
A static investment strategy has not led to static exposures, but increased concentrations in the winners of the last decade. That has been rewarding for investors as momentum has persisted. But as 2022 showed, it carries risks. Each of those three areas is more richly valued than its opposite. The US market trades at 22 times earnings, versus 14 times for shares elsewhere. Giant stocks trade at 20 times earnings, while the median global stocks trades at 17 times. Tech shares are valued at 30 times expected earnings, while other industries are valued at just 16 times in aggregate. Passive exposure to global stockmarkets has led to heavy concentrations in the most richly valued parts of the market.
Investors are concentrated in recent winning styles
That would be alarming enough, as close to 70% of the assets in Australia’s 10 biggest retail global equity funds are in passive strategies. But investors have also actively allocated to styles best suited to the day that is now approaching dusk. If we look just at the 10 biggest active retail global equity funds in Australia, Figure 4 shows that 66% of active assets are in growth strategies— those that generally pay higher prices for companies expected to grow more quickly. Only 10% of assets are in value strategies. Concentration in growth has worked fantastically well over the past 15 years. The largest active fund which has a growth style, trounced the broader market and a blend of the three biggest active global equity funds, which all have a growth style, beat the broader market over the same period.
Figure 4: Investors are highly concentrated in growth funds
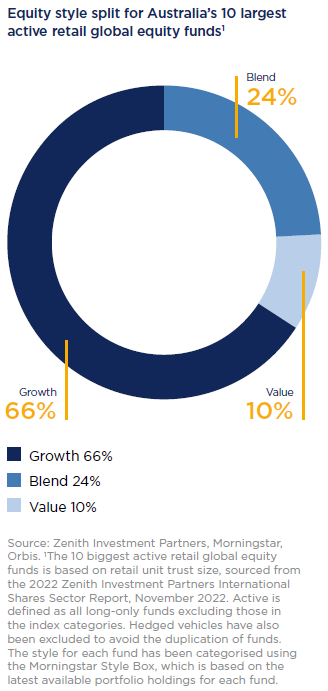
Figure 5: It has been a great environment for growth-style funds
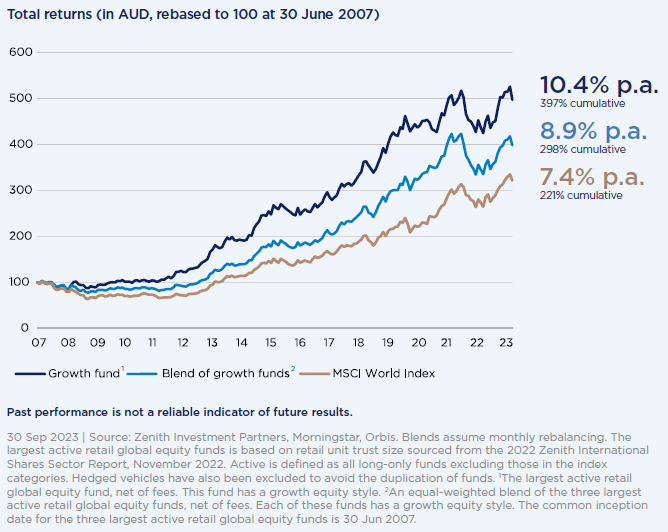
That is not just down to luck. While we prefer to focus on valuations, managers with a sound growth philosophy and the structure to stick with it over the long term can deliver very healthy returns.
The trouble is what happens when that falls out of favour. If investors hold multiple active funds to get diversification, but those active funds invest in very similar things, investors can end up being diversified in name only. But as Figure 6 shows, being diversified only in name is painful when trends change.
Figure 6: Holding similar funds is risky when that style falls from favour
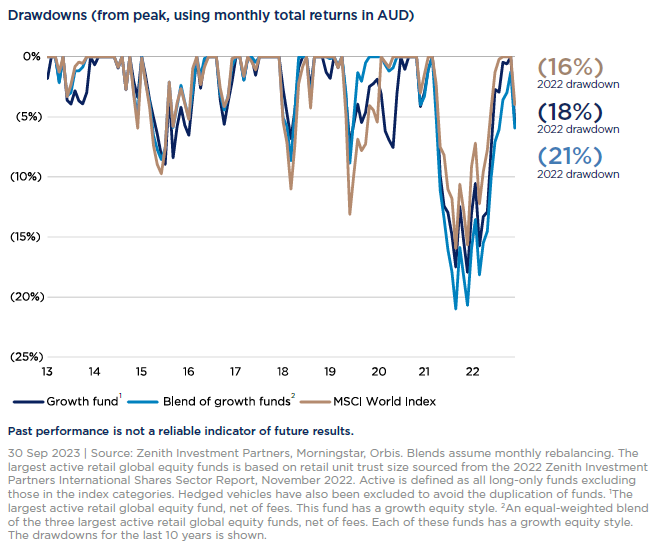
In 2022 the broader global equity market fell around 16%, and after a bit of a recovery this year, it is still down around 4%. The largest active retail global equity fund, which has a growth style, fell slightly more with a decline of 18%. Attempting to diversify by holding the two other largest active retail global equity funds did not help at all because they also have a growth style. Investors in that mix of funds saw declines of 21%, and are still underwater today.
Yet investors remain concentrated, with the bulk of their active assets in growth-style funds, and their passive assets concentrated in giant US technology shares. With valuations where they are today, that worries us. If they do not adjust their portfolios, they will need to adjust their expectations.
Value stocks are still attractive
Value has suffered a long, dark night. Having thrived for nearly a century, value has lagged since the Global Financial Crisis, suffering the deepest and longest drawdown in its history. That underperformance has left value stocks trading at exceptionally attractive prices, even after a good year in 2022. In a still-expensive market that has grown ever-more concentrated in richly priced US, mega-cap, and tech shares, value stocks offer both a refuge and a source of opportunity.
But as fundamental, long-term, contrarian investors, we look at companies like business owners, and as business owners, the single most important metric is free cash flow. If you own a business outright, free cash flow is your money—to reinvest in profitable projects, buy a competitor, pay down debt, pay out dividends, or buy out your partners. It is the single measure that best captures the true worth of a business. And if we look at the free cash flow valuations of the most neglected companies, we see reasons for excitement.
That is not true for the market as a whole, as Figure 7 shows. On a price-to-free-cashflow basis, we see the same pattern as for the other measures. In the years since the global financial crisis, markets in aggregate have got more expensive, and are currently near their richest levels since the original Tech bubble in 2000.
Figures 7-8: Free cash flow
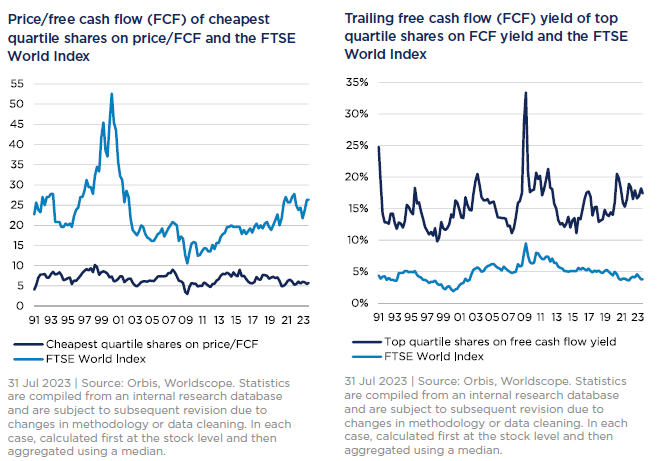
The pullback of 2022 barely made a dent. The typical global stock trades at over 25 times free cash flow. If you owned it outright, it would take 25 years of current cash flow to get your money back. Investors are hoping for rapid growth. In fact, the market’s valuation is so stretched that the multiple of the neglected shares is barely discernible.
We can change that by inverting the ratio, and looking at free cash flow yield, or free cash flow divided by price. This reveals a more promising picture.
While the overall market is expensive, the most neglected quarter of shares offer free cash flow yields of 17%. If you bought one of these businesses outright, and assuming cash flows stay flat, you would reap an ongoing return of 17% per year. You could get your entire investment back in about six years—and could still own a profitable business at the end of that period.
This excites us, as it suggests a wider opportunity. Cash flow is underappreciated at a time when investors desperately need the diversifying benefits of value stocks.
Rob Perrone, Shane Woldendorp and Eric Marais are Investment Specialists at Orbis Investments, a sponsor of Firstlinks. This article contains general information at a point in time and not personal financial or investment advice. It should not be used as a guide to invest or trade and does not take into account the specific investment objectives or financial situation of any particular person. The Orbis Funds may take a different view depending on facts and circumstances.
For more articles and papers from Orbis, please click here.