As the bull market in shares enters its ninth year (for the US at least), there is increasing need for investors to protect the value of their equity portfolio. Market valuations are near record highs, interest rates are starting to rise and geopolitical risks around the globe are causing concern.
One way to protect against market movements is options. Put options give the buyer the right but not the obligation to sell the underlying asset at the strike price, but there are some important factors to consider.
Lack of volatility suggests lack of fear
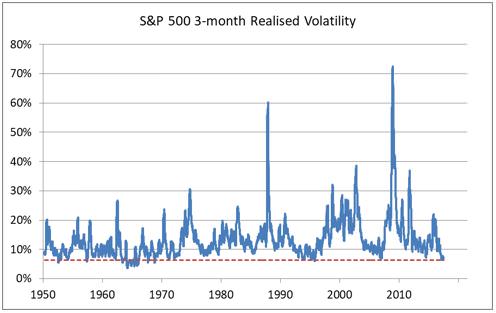
As the bull market continued in the first half of 2017, market volatility was all but non-existent. The S&P 500 index is rarely calmer than it has been in the past few months, with the daily return in the index no more than 0.25% either side of zero.
This ultra-low volatility also carried over into the options market, as demonstrated by the ‘fear gauge’ VIX index, which measures expected future volatility in the share market using S&P 500 option prices. It has plunged to historical low levels and has been bumping along at those levels for some time. In other words, there is no fear in the market. As a result, options are cheap. At face value, this would seem to mean that it is relatively cheap and easy to use options to protect from market downturns. But there are other considerations.
Vagaries of option pricing
In the absolute sense, options are cheap, as the VIX index stayed below 10 on a daily closing basis for more days this year than it had before over the previous 27 years combined. To provide some context, the VIX hit highs of close to 80 during 2008, and it rarely falls below 10 historically. While the VIX remains low and stable compared to movements in its underlying asset, the S&P 500, there’s more to the story.
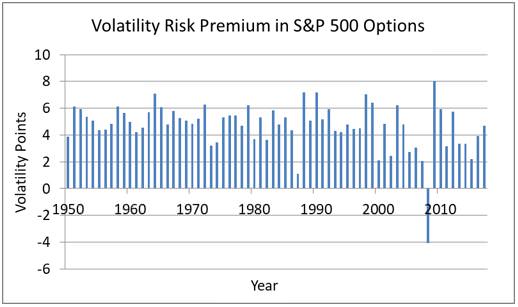
Actual volatility in the S&P index has been stuck in the 6-7% range for months. This is a whopping 4-5% lower than the average VIX index level. But we need market volatility to almost double for most long volatility options trades to be worthwhile. This is because options typically trade at a premium to their real worth, measured by comparing their implied volatility to the actual volatility of the underlying asset. This is often termed the ‘volatility risk premium’ which is persistently positive most of the time – indeed, close to 90% of the time for the S&P 500. This is partially due to the structural imbalance between those investors that demand options and those who are willing to supply them and thus bear the risk of unlimited downside losses associated with short option positions.
Most investors that purchase put options consider them to be an insurance policy. They know that they are on the back foot most of the time when they consider buying options to protect their stock portfolio. But just like buying insurance to cover other aspects of our lives, buying options is still an important exercise with significant potential benefits if applied in a cost-efficient manner.
A second, equally important, consideration relates to which options to buy. One key aspect is the strike price. This is the price at which the option kicks in. For instance, if the market was sitting at 6000, an investor might buy a put option with a strike price of 5000. It would only kick in if the market falls to and below that level. Different strike prices cost different amounts, and consideration needs to be given to which ones allow the most value for money. Each option has its own implied volatility ‘price tag’.
The chart below shows the implied volatility skew of 2-month S&P 500 put options on 14 July 2017 when the stock index was at all-time highs and the VIX was near record low levels. While ‘near-the-money’ options contracts – which are those that have a strike that is close to the index - have historical low implied volatilities below 10%, the far ‘out-of-the-money’ contracts – those that have a strike that is far below the index – still command implied volatilities in excess of 30%. However, they are not reflected explicitly in the VIX as they carry little weight in the index calculation due to their small premiums.
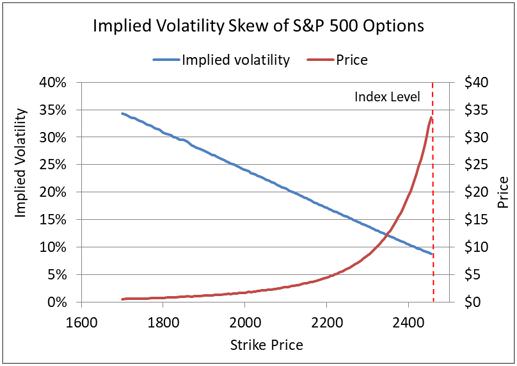
Hence looking through the lens of implied volatility, ‘near-the-money’ options offer the best value whereas far ‘out-of-the-money’ options are the most expensive. One may argue this is a biased lens as the mathematical model behind it assumes asset returns have a bell-shaped distribution. But this is actually more or less true under normal conditions as the market only deviates significantly from the bell shape at times of stress.
The selection of appropriate strike prices
Another way to select strikes is to consider how often these options become ‘in play’, i.e. when the stock index moves substantially closer to the strike price from its initial level. Consider the profile of historical 1-month returns for the S&P 500 since 1950.
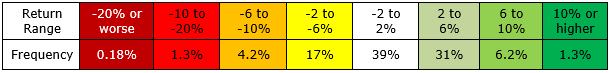
Over six decades of historical data shows that the S&P 500 experienced a 1-month return of minus 10% or worse approximately 1.5% of the time. And just over 10% of these instances were crashes of minus 20% or more. Most drawdowns were much shallower in magnitude, and they occur at much higher frequencies, accounting for more than a fifth of all monthly returns.
Therefore, there is a much higher probability of ‘near-the-money’ put options having a positive impact on the stock portfolio. Far ‘out-of-the-money’ puts, despite being very cheap in dollar terms, are severely overpriced when measured in implied volatility, and they only come to your rescue in the most dire market situations – which happen very rarely.
Why tail risk hedging may not work
Unfortunately, this exact philosophy of using far ‘out-of-the-money’ puts is being deployed by a popular hedging strategy called tail risk hedging. One such strategy spends 0.5% of assets per month buying 2-month index put options with a strike price that is 30% below the index level, and rolls these positions forward each month. If the index drops by minus 20% in a month, the managers claim the rise in value of these puts will more or less offset the losses in the stock portfolio.
This may well be true. But apart from this worst-case scenario, the put option is almost guaranteed to lose most of its value after a month in most other scenarios. That is a whopping 5-6% of premium burn per year, a horrendously huge drag on any investor’s portfolio. Even the fund managers have realised the deficiencies and stressed the technique only outperforms when markets are deemed to be overvalued. But it goes without saying that markets can remain irrational for longer than most people expect.
One smarter way to design a hedging programme is to shift some of the focus onto the shallower drawdowns which happen 100 times more frequently. This results in a higher probability of generating positive returns and allows for more degrees of freedom in both strike selection and trade management. A simulated example is shown below.
An alternative hedging approach
When near-the-money options are involved, we may take advantage of the steep volatility skew by buying put spreads instead of single put options. That is, we sell a further out-of-the-money put and use the premium to partially fund the purchase of a closer-to-the-money put which requires high dollar premiums. This works especially well in a steadily rising market as most drawdowns tend to be short in duration and capped in magnitude.
We will also make some use of far out-of-the-money options with strikes up to 20% below the index level, because they offer higher leverage and convexity if the market does drop substantially. Furthermore, each trade has its own trigger levels and other trading rules to make sure we are taking some profits off the table during market drawdowns and losing positions are rolled in a timely fashion to reduce premium burn.
Annual results are shown in the table below for a hedging programme with a 1% annual budget.
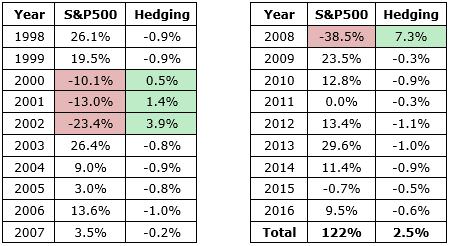
For a relatively small budget, the hedging programme should provide some protection in major market disruptions such as 2008. The market was down 38.5% with hedging providing 7.3%, which while obviously not a perfect hedge (as the technique and budget do not attempt that), it is a solid platform to outperform peers. For the prolonged bear market of 2000–2002 where declines were more gradual and drawn out, the hedging programme generated modest but positive returns every year, peaking at 3.9% in the worst year. This would be difficult to achieve if only 30% out-of-the-money puts were bought.
This more dynamic strategy is an improvement over standard tail risk hedging, although it is still a drag to the stock portfolio in rising markets. Other hedging solutions can harvest some of the risk premium in more sophisticated structures, which we shall outline in follow-up articles.
Simon Ho is Executive Director at Triple3 Partners. This article is general information and does not consider the circumstances of any individual.