The second half of 2016 is shaping up as one of the more negative half years for bond returns on record, especially at the long end of the yield curve. It’s not uncommon for financial press articles to refer to what’s happening to government bonds as a 'rout', but is it really that bad?
The focus of this article is the US Treasury market, bond yields, and what that means for bond returns.
Since early July 2016, when 10-year Treasury yields traded at an all-time low of 1.36%, the trend has been higher. It was a steady burn for a few months, but the speed of the increase has picked up since early November. This was around the time financial markets started to price in a Trump victory, a few days out from the vote.
As of 9 December, an investor could purchase a 10-year Treasury to yield 2.47%. Of the 1.11% increase over the past five months, around 2/3 has happened over the past four weeks, and an increase of 0.77% over a month is a very sharp move by historical standards; not unprecedented, but far from common.
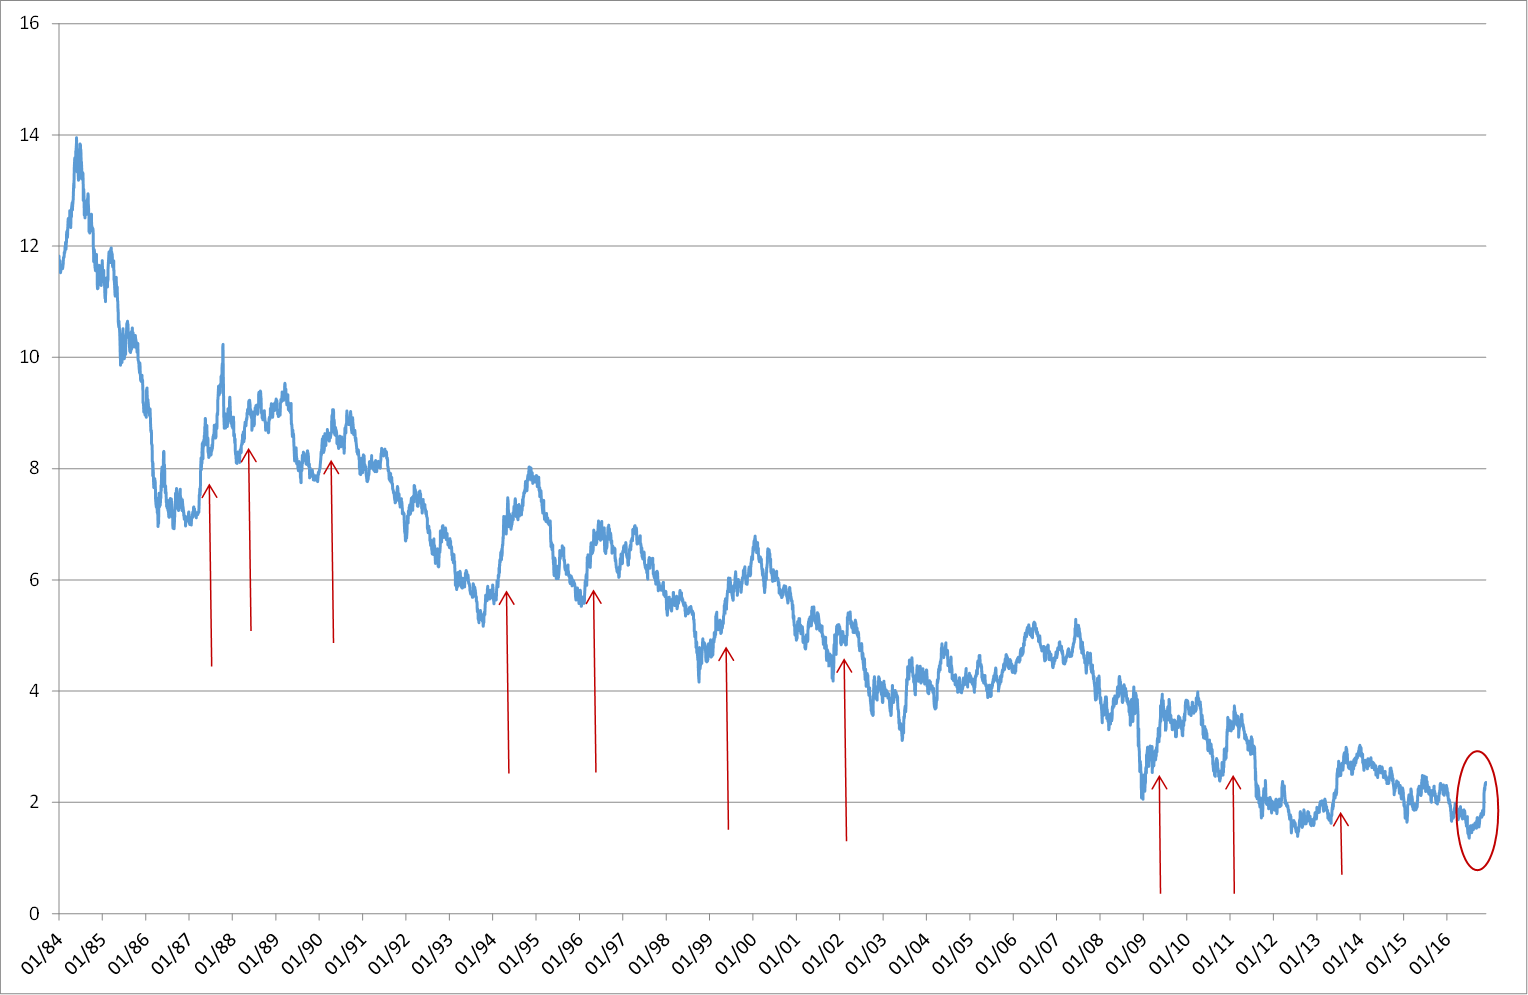
The following chart shows the history of the 10-year US bond yield since the all-time peak back in 1983. Since then, there have been 10 prior periods (shown by the arrows) where the yield has increased by at least 0.9% over around 5-6 months.

In other words, history tells us we can expect a long bond yield rise of the magnitude we’ve seen in 2016 on average once every three years.
Of course, this rising trend may not yet be over. The 1.11% rise posted so far could turn into more, so what does history tell us in this regard?
History repeats, but how often?
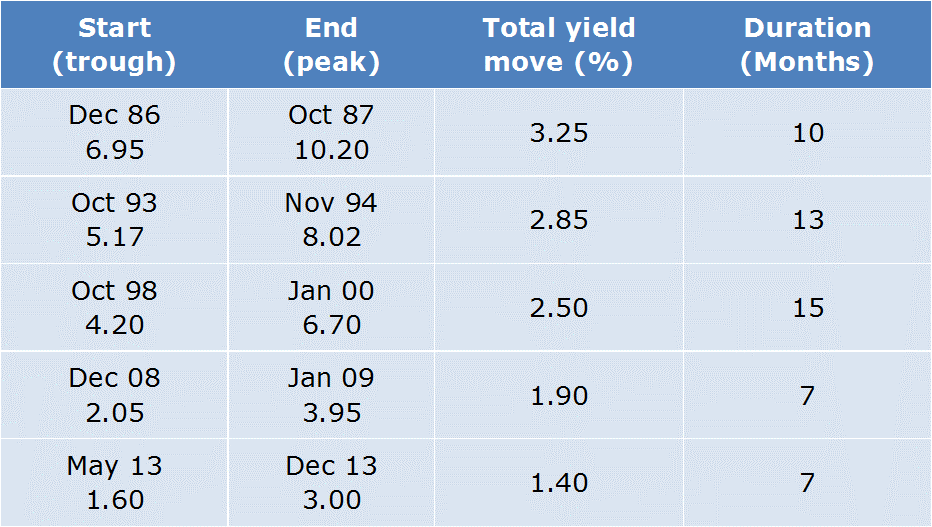
Not surprisingly, history does not provide much clarity. Even if there were a regular pattern, a sample size of 10 is nowhere near enough to draw firm conclusions. However, there isn’t a regular pattern. Half of the previous 10 occurrences of at least 0.9% increases petered out around this level. If those histories are repeated, then this ‘rout’ is just about done and dusted.
The other half, however, continued for varying lengths and to varying degrees. If these histories were to repeat, then there’s a way to go yet before we reach the peak in this cycle for US yields. The following table summarises those episodes.

The impact on bond prices and bond returns
Of course, when bond yields rise, bond prices fall, at least initially (every bond matures at par, whatever happens today or tomorrow). When the time period over which this happens is short enough, total bond returns can become negative as well.
The recent yield increase translates into a decline in the capital value of the 10-year Treasury bond since early July of 10.0%. Here we have a living, breathing instance of the usual example that’s used to explain what 'modified duration' means. That is, if you get a yield move of 1% you multiply the duration to get the price change. In this case the yield move was a little bit more than 1%, but with the modified duration of the current 10-year bond at around 9.2 years, the maths follows.
Adding back the interest that’s been paid and accrued, the total return on the bond over the past five months has been -9.4%.
To compare this with history, it’s easier to use data for a bond index, such as the Bank of America Merrill Lynch 10-15 year Treasury index. The total return on this index over the past five months has been -8.6%. This ranks as the third worst return over a similar period in the past three decades. It was outdone only by 2013’s ‘taper tantrum’ of -9.9% and the -9.1% from the yield rebound in 2009 that followed the Lehman collapse.
The reason a yield move that has already occurred 10 times has resulted in a total return among the worst few in history is mostly because of the starting yield. When 10-year bonds have risen by about 1% in the past, they’ve been paying 4%, 6% or higher interest returns. That provided a larger positive contribution to the total return over any five-month period than July 2016’s 1.4% yield. Low yields also mean longer bond duration, which magnifies the impact of a given yield change. For instance, in a 6% yield environment, the 10-year bond’s duration would have been around 7.5 years instead of more than nine years. So a 1% yield change today means an additional 1.5% in capital value adjustment.
What does this mean for Australian bond investors?
Most Australians hold a portfolio that is more of a composite of domestic government, semi-government and corporate bonds. Their portfolio at July’s low point was yielding 2% and has seen an increase to around 2.6%. That’s a much more moderate change than has taken place in the 10-year Treasury market. Also, the local market has a significantly shorter duration of about 5.3 years. Therefore, broad Australian bond market indexes over the past five months have returned a much more moderate -3% or thereabouts.
Furthermore, the one-year returns for 2016 will be positive. The broad market index seems likely to come in at around +3%, so still above cash. This is because the sell-off in the second half of 2016 followed a rally in the first half of the year.
End of the bull market?
What we’ve witnessed over the past few months could well mark the end of the so-called '30-year bull market in bonds'. The possibility that yields will continue to trend higher, back to pre-GFC levels where 10-year Treasuries paid investors 4% or more, is not objectionable. It would be fantastic if that happened, because it would mean that world economic fundamentals had healed, after being so badly damaged in the last decade or so. It would mean that bond markets were experiencing rising returns – short term capital pain, yes, but rising reinvestment into a higher-yielding environment that will produce better long-term outcomes than the low yields we’ve seen during 2016.
However, it’s still far too early to call the end of the 'lower-for-longer' scenario. Just because bond yields have risen from their all-time lows doesn’t mean they’ve broken out of the historically low trading ranges of the past few years. They might do that, but they haven’t yet.
Warren Bird is Executive Director of Uniting Financial Services, a division of the Uniting Church (NSW & ACT). He has 30 years’ experience in fixed income investing. He also serves as an Independent Member of the GESB Investment Committee.