Gold is the preeminent monetary metal, and throughout history to this day, it has projected the most enduring images of wealth. Consider how often gold bars are used to depict glamour and riches. Silver is in its shadows, but as an asset, it contains similar wealth-protecting qualities, perhaps with even greater return potential.
Unlike physical gold, which is used very little in industry, physical silver is an input in a wide range of industries including photography, medicine, defence and electronics. Silver is the best conductor of electricity and heat and is a highly reflective metal.
Modern medicine has recently rediscovered silver's anti-bacterial qualities, with its germ-fighting properties leading to an explosion in products containing silver. From silver-impregnated sportswear (to kill the germs which cause body odour), fabrics for public transport and airline seats to prevent the spread of infections, coatings for fridges and washing machines and even in antiperspirant sprays and band-aids.
As the best conductor of electricity, silver is used in solar panels to increase efficiency and in wiring, switches and soldering contacts. Silver oxide batteries (probably like the one in your watch) are increasingly used to power larger devices as they store the most power relative to size of any battery.
Silver is also used in iPhones, iPads, cell phones and flat screen televisions, with over 10,000 known industrial applications.
Silver prices are currently relatively low, making recycling largely uneconomic and therefore, much of the silver used in products is lost to landfill. This may change if the price rises substantially, but for now, it’s a bullish factor underpinning the silver market.
Silver as monetary metal
Whilst silver is heavily used in industry, it has an incredible history as a monetary metal. Known as Argentum in Latin, the Ancient Egyptians, Lydians, the Greeks, and the British all valued and used silver as a monetary asset.
There is a reason why British money is referred to as Pound Sterling. Indeed, the term dollar can be traced back to the 1530s, and a legendary Bohemian silver mine near Joachimsthal, which at its peak produced over three million ounces of silver a year.
The coins produced from this mine were called Joachimsthaler, or ‘thaler’ for short, and these silver coins formed the basis of the Dutch ‘daalder’. The ‘daalder’ became the most popular trading currency in the Dutch founded town of New Amsterdam, known today as New York, where they were known as dollars.
Current demand and supply
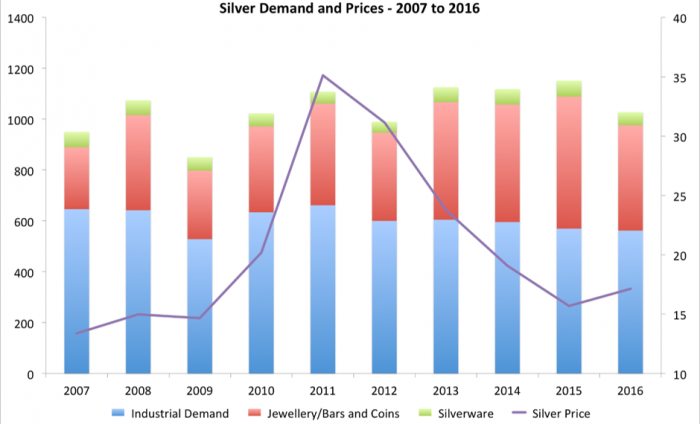
The chart below shows the breakdown of silver demand over the last 10 years, as well as the move in the US$ silver price over this time. Approximately half of the demand comes from industrial applications, with jewellery and implied net investment, predominantly bars and coins, comprising the majority of the rest. Investment demand has increased markedly over this period, with bar and coins sales tripling between 2007 and 2016.

Source: GFMS via Thomson Reuters, ABC Bullion
The majority of the current supply comes direct from mine production, with about 20% of total supply across the last 10 years coming from silver scrap. A significant portion is mined as a by-product, meaning that the mine the silver is coming from is predominantly in place to produce other metals, like gold, copper, or zinc and lead, with more than half of the silver coming from Latin America.
The fact that silver is so often a by-product adds a degree of inelasticity to supply, in that a copper miner isn’t going to increase production if the price of copper is falling or stagnant, just because the silver price is rising. The miners are often not overly interested in the silver, as it probably only consists of a small portion of the miners’ overall revenue.
Net government sales were a source of supply to the market until recently, but have effectively stopped, as national silver bullion reserves the world over are all but completely depleted.
The gold/silver ratio and the future of the silver market
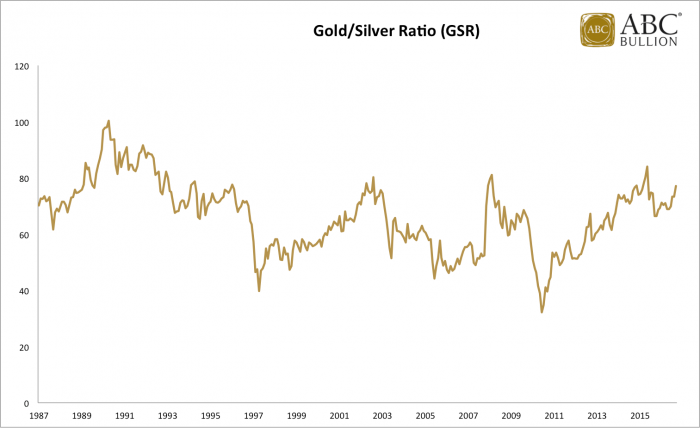
Whilst we expect silver to be the more volatile of the two monetary metals, the gold/silver ratio (GSR), which measures how many ounces of silver one needs to buy one ounce of gold highlights why we believe silver prices may rise by more, in percentage terms, than gold in the coming years.
The GSR is currently about 78, with gold at US$1,260 an ounce and silver at about US$16.20 an ounce. This is nearly 20% above the average of the last 30 years, a timeframe in which the GSR has averaged just over 66. Indeed, as per the chart below, the GSR is currently at a level that has only been exceeded once in the past 30 years.

Going forward, there are a handful of reasons why the GSR should be lower than the current reading of 78.
Firstly, as per the chart above, since the turn of the century, the GSR has approached current readings three times, back in early 2003, again in late 2008, and toward the end of 2015. Each proved good buying points for precious metals, with silver in particular rallying from these levels in the subsequent year, with average gains of nearly 20%.
Geology and mine production are factors too. Gold occurs in the earth at a rate of 4 parts per billion (PPB), whilst silver occurs at 75 PPB. This ratio of about 19:1 indicates that there is roughly 19 times more silver in the ground compared to gold. Given gold production has averaged around 2,800 tonnes per annum over the last decade, one might expect (based on a silver/gold PPB ratio of 19:1), that about 53,000 tonnes of silver would be mined each. In reality, primary mine supply is barely half that, with the latest data from the Silver Institute suggesting annual silver mine production is just 27,500 tonnes.
Industrial demand, should global growth accelerate from here could also propel silver prices in the years ahead. Industrial demand is essentially a non-factor in the gold market, but a major factor in the silver market. As such, silver stands to benefit if governments get their wish of higher global demand and a pick-up in inflation, which they almost certainly will should they unleash fresh bouts of fiscal stimulus.
Finally, it’s worth looking at the size of the gold and silver markets from an investor’s perspective. Gold demand in 2016 was just over 4,300 tonnes, worth over US$170 billion at an average price of US$1250/oz. Silver demand on the other hand came to just shy of US$18 billion, meaning gold demand was nearly ten times higher than silver demand.
As such, it takes less dollars to move the silver market, a factor that may prove decisive if more investors seek to hedge their portfolios with a precious metals exposure. There are portfolio benefits of including precious metals in a diversified mix of assets.
Add all these factors together, and silver, a quasi-industrial metal with a rich monetary history, may be about to step out of gold’s shadow, and shine brightest in the years ahead.
Jordan Eliseo is Chief Economist at ABC Bullion. This article is general information and does not consider the circumstances of any individual.