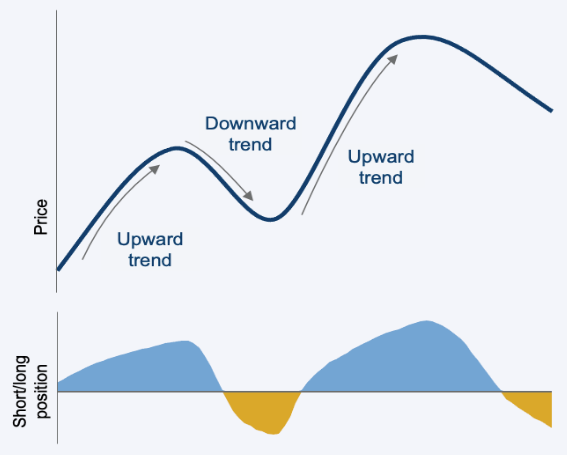
At its core, trend-following is an investment strategy that seeks to profit from markets that are showing price trends in any given direction. If prices are trending upwards, trend-following strategies will go long the market; if they are trending downwards, trend-following strategies will go short. The mechanics are a little more complicated and making a success of it comes down to things like which markets you trade, how you size your positions and how you control your risk. But that is the basic premise.

Trend-following strategies – also commonly referred to as ‘momentum,’ ‘managed futures,’ and ‘CTA’ strategies – have been employed for decades. While some of the assumptions that are self-evident in classical economics suggest trends cannot exist because markets are perfectly efficient and information is instantly reflected in prices (the efficient market hypothesis which was popular with academics in the ‘70s and ‘80s), the evidence clearly shows that this is not the case. Information is not instantly reflected in prices, people aren’t entirely rational, trends do exist, and an edge can be gained.
Indeed, even in ancient Sumer, the cradle of civilisation, we see evidence of price trends. The discovery of a stone tablet from 5000 years ago recorded corn-prices over several years, and if you look at the time series of those corn prices you can clearly see that they exhibited strong trends.
There are many reasons why markets aren’t perfectly efficient and have a tendency to trend in a particular direction. Macro regime changes are one. For example, the shift to an inflationary regime and rising rate environment over the past year and a half had a ripple effect across markets, and it took time for market participants to digest that information and its wider implications. There's an initial under-reaction and then you see trending type behaviour as markets fully reflect the news. Regime changes can also take several years to play out, as we have seen with sustained inflationary pressure and central bank reactions, or the period of quantitative easing (QE) that preceded it.
Another reason is that investing decisions are made by humans and humans are emotional beings subject to behavioural biases. The pioneering work of Nobel prize winners Amos Tversky and Daniel Kahneman showed that people often act irrationally and harbour a range of cognitive biases that influence their thinking.
For instance, they showed that we suffer from ‘anchoring bias,’ where we give a disproportionate amount of weight to the first piece of information received when thinking through a problem or planning a decision. Investors also have a ‘loss aversion bias,’ generally feeling the pain from losses twice as much as the pleasure from gains, and a propensity for ‘herding’ behaviour.
These phenomena lead to things like panic selling and panic buying and enable stock prices to deviate remarkably from their expected fair values at any given time. Panics, bubbles, booms, and busts, like the dot com bubble or Black Monday, arise as a consequence and create price trends.
The mechanics
There are numerous approaches that can be employed to identify trends and build trend-following models. The core building blocks tend to include ‘moving-average crossover models’ and ‘break-out signals’. When it looks like a price trend is developing because, for example, a shorter-term moving average has broken out of a certain range, the model will generate a signal to adjust allocations.
Trend-following strategies can trade a variety of different markets, including stocks, credit, fixed income, commodities, and currencies. In fact, usually the more markets they trade the better. Trends develop in different markets at different times, and the strategy is designed to adjust its allocations to where trends and price action are happening. The more markets that can be accessed, the higher the chance of finding trends to profit from. To enable them to be nimble, they invest in highly liquid securities like futures contracts and other derivatives.
Trends can develop over a variety of time horizons, whether slower trends that manifest over a few months or faster trends that happen over a few weeks or days. The best trend-following strategies generally combine faster trend following models with slower ones – faster models can react faster to sudden price changes and are more positively skewed, while slower models tend to have a better Sharpe ratio (or risk-adjusted return) but are more negatively skewed.
A systematic approach
Most trend-following strategies take a systematic approach, using coded algorithms for the entire investment process – from cleaning and ingesting data to identifying signals, deciding which trades will be profitable and how to size trades, and executing those trades. This enables them to invest in a disciplined, consistent way, devoid of emotion and according to the principles and rigorous methods that have been pre-determined by the algorithms.
One obvious advantage of this is that it means the strategy can achieve scale. Markets can be traded 24/7 because the entire investment process is automated, enabling access to a much larger pool of markets around the globe and by extension, greater diversification (the only ‘free lunch’ in the investment world).
It also removes human emotion and cognitive bias from the investment decision-making process, avoiding situations where discretionary investors may exit a trade too early because of fear, for example, and not capitalising on an enduring trend. The strategy also always stays on course – whether maintaining set correlation levels between securities to ensure diversification or scaling the portfolio based on volatility and reducing risk.
How does it fit into a portfolio?
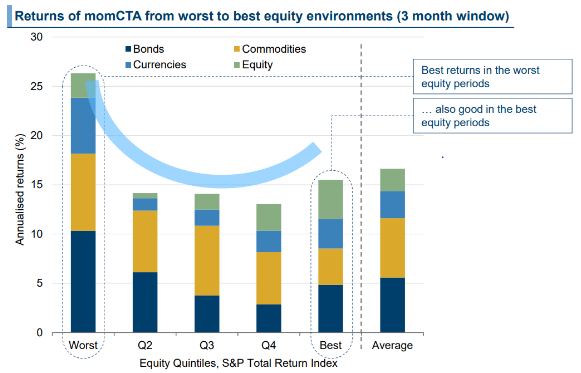
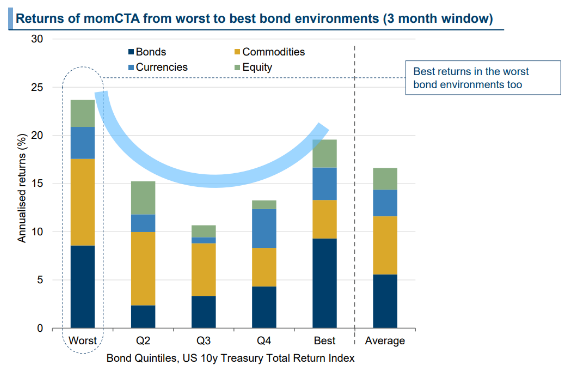
Trend-following strategies are often uncorrelated to other asset classes, which provides diversification benefits to an investor’s portfolio. They have also been shown to perform best when markets are at their worst, providing what has been deemed ‘crisis alpha.’
If you look at the performance of momentum strategies from 1960-2015, for example, you can see that the annualised average return for the representative BTOP50 managed futures index is highest in the best and worst periods for the S&P Total Return Index. The same is true for bond markets and can be seen in the two charts below. What’s interesting is that it’s even better during the worst periods than it is in the best. For example, during the 2008 financial crisis, global stock markets lost 49.3% while the BTOP index made 16.5%.[i] The same was seen during the dot com bubble and the Covid-19 pandemic.[ii]


Integrating trend-following strategies into a long-only portfolio can therefore provide important tail-hedging properties. It enables investors to participate in the upside of markets with their long-only allocations (as well as their trend-allocations) and helps protect on the downside when crises hit. Holding stocks and trend gives higher risk-adjusted returns and lower drawdowns than holding stocks or other traditional assets alone because trend-following’s risk is significantly lower, whether risk is measured in terms of volatility or maximum drawdown. If you look at the Barclay BTOP50 Index (BTOP) and the MSCI World Net Total Return Index (MSCI World) between January 1987 and March 2023, you can see the BTOP50 had lower volatility (9.6% versus 14.4%) and a lower maximum drawdown (-16% versus -50%) than the MSCI World Index, while delivering an annualised return only 0.7% shy (7.0% vs 7.7%).[iii]
Perhaps the best thing about trend-following is that it doesn’t really matter what markets are doing. By taking advantage of a feature of markets that has been observed for thousands of years, they can profit when things are going up - or down - and provide investors with strong returns, diversification, and tail hedging all in one neat package. What’s not to like about that?
Kit Cherry is a Director, Sales Strategy at Man Group, a specialist investment manager partner of GSFM. GSFM Funds Management is a sponsor of Firstlinks. GSFM represents Man AHL and Man GLG in Australia. The information included in this article is provided for informational purposes only. Man Group do not represent that this information is accurate and complete, and it should not be relied upon as such. Any opinions expressed in this material reflect our judgment at this date, are subject to change and should not be relied upon as the basis of your investment decisions.
For more articles and papers from GSFM and partners, click here.
[i] 2008 financial crisis performance period - 1 July 2007 to 28 Feb 2009
[ii] Dot com bubble performance period – 1 Apr 2000 to 31 Mar 2003; Covid-19 performance period – 1 Feb 2020 to 31 Mar 2020
[iii] Source: Man Group, BarclayHedge, Bloomberg; between 1 January 1987 to 31 March 2023.