The Weekend Edition includes a market update plus Morningstar adds links to two additional articles.
The latest data from regulators APRA and the ATO show SMSFs are continuing to thrive:
1. There are almost 612,000 SMSFs, as of September last year. That’s a 3.5% increase on the previous year and a 9% rise over the past five years.
And the number of SMSF members has reached 1.12 million.
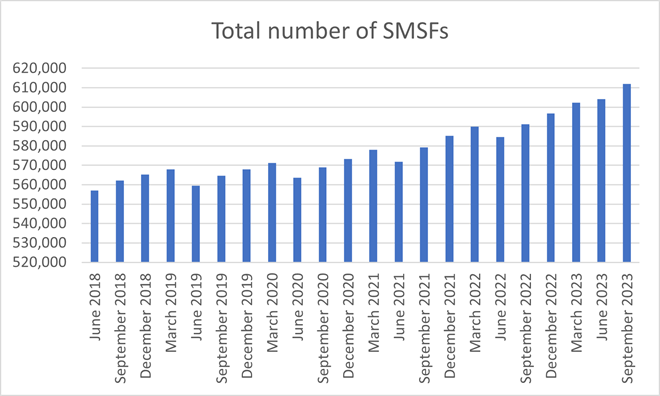
Source: ATO, Firstlinks
2. The total assets held by SMSFs has increased to $885 billion. That’s up 5.6% over the year to September 2023, and 31% over the prior five years.
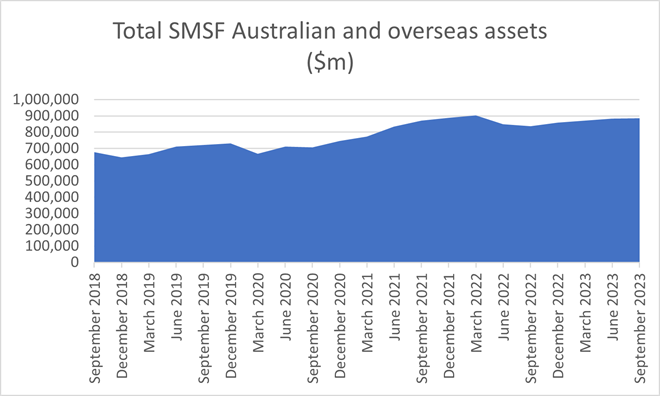
Source: ATO, Firstlinks
3. The average SMSF has nearly $1.5 million in assets. Almost 45% of SMSFs have funds from $200,000 to $1 million. And 37% have funds between $1 million and $5 million.
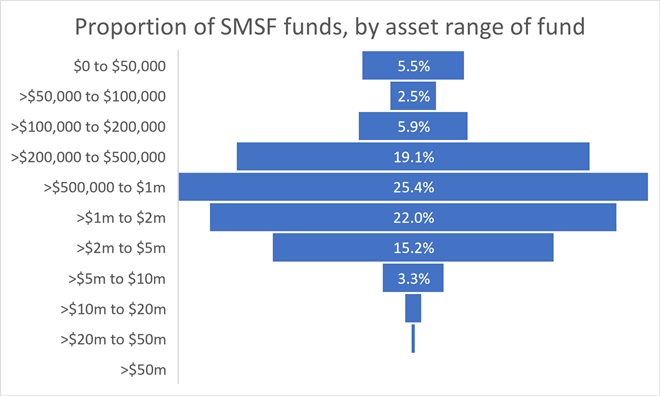
Source: ATO, Firstlinks
The proportion of funds under $1 million has steadily declined from 65% in 2018 to 58%.
4. SMSFs favour listed shares, cash, unlisted trusts and non-residential property. Stocks are 28% of funds, cash and term deposits are 17%, while unlisted trusts 13%.
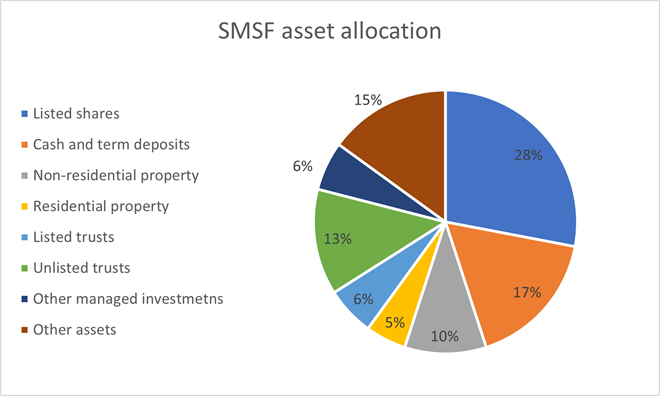
Source: ATO, Firstlinks
Unfortunately, the ATO only has a breakdown of SMSF asset allocation by fund size up to the 2022 financial year. Yet this data is fascinating as it shows that the greater the fund size, the less money is allocated to cash. For example, SMSFs with less than $50,000 in funds had 45% invested in cash and term deposits, compared to just 12.5% for those with $50 million or more.
Wealthy SMSFs have more money in listed shares, non-residential property, and unlisted trusts. No doubt, the latter two are due to them having more access to these asset classes.
5. The median age of SMSF members of newly established funds was 46. Meanwhile, the median age of all SMSF members was 62.
6. 65% of SMSFs have existed for more than 10 years.
7. SMSFs’ share of total superannuation assets dropped from 26% to 25% in the year to June 2023, according to the latest annual superannuation bulletin from APRA. But it’s held firm around 25% for the past five years.
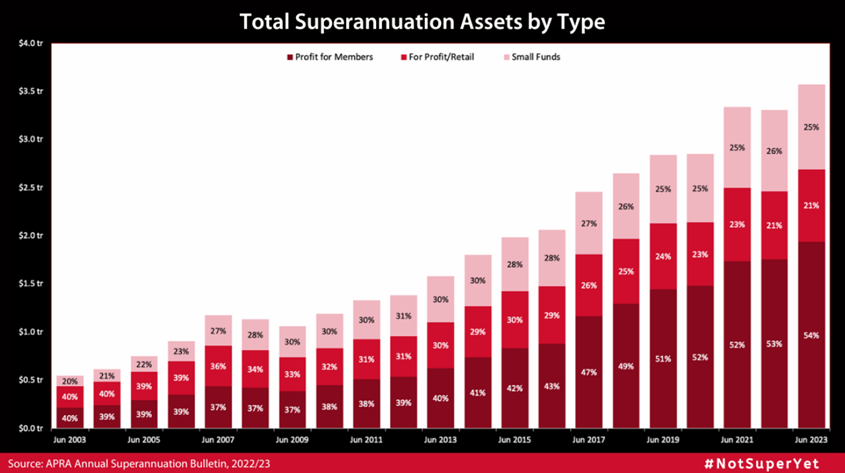
The APRA report says total super assets increased to $3.6 trillion in the year to June 30, 2023. To put it into perspective, that figure compares to the total value of the ASX of $3 trillion, though it still trails the largest asset pool in Australia, namely residential property, valued at $10.3 trillion.
Profit for member funds, which include industry funds, public sector funds, and corporate funds, have been the largest gainers over the past year and decade. In 2013, these funds were 40% of total super assets; now they are 54%.
Retail funds have been the big losers. They now comprise just 21% of total super assets, down from 30% a decade ago.
***
At a conference hosted by Firstlinks’ sponsor Pinnacle this week, David Allen from Plato Investment Management opened his presentation with this slide.
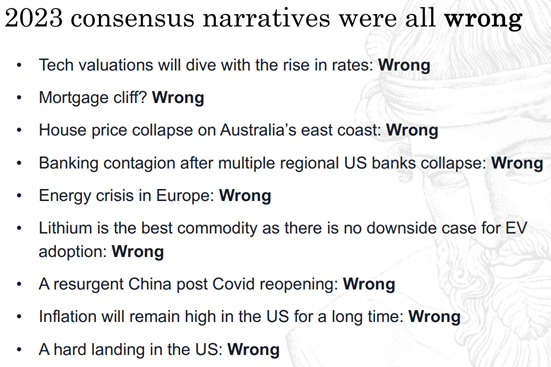
Source: Dr David Allen, Plato Investment Management
David Allen went on to suggest that if investors had behaved like George Constanza in that famous Seinfeld episode where he does the opposite of his every instinct, then they would have had a great 2023.
That strategy doesn't always work, of course, though it’s perhaps worth pondering what the main consensus narratives are for 2024. Here are my suggestions:
- Inflation will head back towards central bank targets.
- Interest rates will fall, first in the US, then Australia, and probably more than the central banks are currently forecasting.
- There’ll be no recession in the US, or Australia.
- A goldilocks economic environment will be positive for both stock and bond returns.
- China may be headed for a multi-year downturn, unless the government stimulates the economy in a big way.
- Lithium and nickel are oversupplied, and those markets will take some time to work through that.
- Australian consumers will have a tougher time but muddle through, as will the housing market.
- Geopolitics is the key area of potential risk, whether it be in the Middle East, Ukraine, or elsewhere.
These consensus narratives for 2024 are already being reflected in markets. In early February, the S&P 500 closed above 5,000 for the first time. It took 757 days for the index to go from 4,800 to 4,900 and just 15 days to go from 4,900 to 5,000.
In the week ending February 9, the S&P 500 had risen in 14 of the previous 15 weeks – a run last seen in 1972.
That’s resulted in the VIX – a key measure of US market volatility – being below 15 for 60 straight days, something that hasn’t happened since 2018.
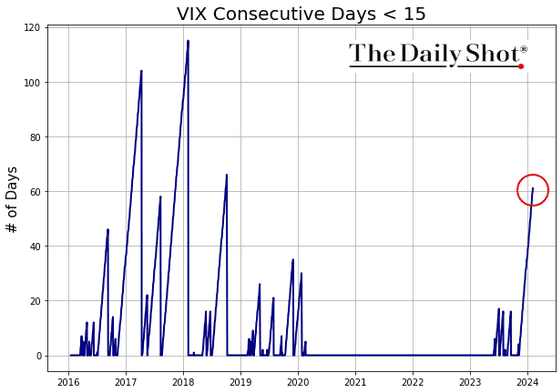
Source: The Daily Shot (February 2024)
Rising markets have lifted the spirits of fund managers. Not many of them predict a recession over the next 12 months.
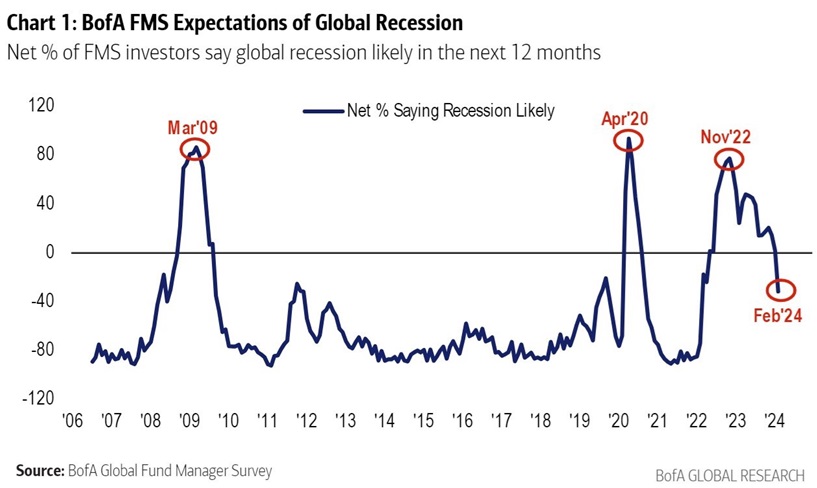
In fact, fund manager sentiment is the most bullish in more than two years. Admittedly though, the bullishness isn’t at extreme levels.
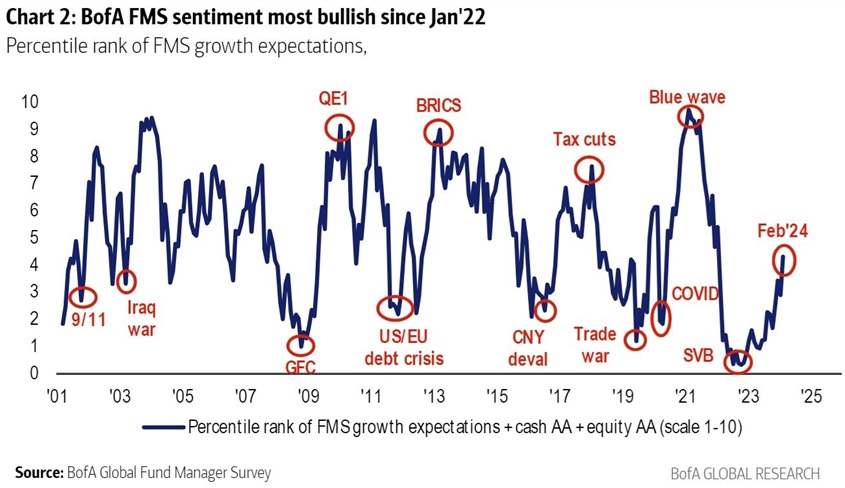
The big question is whether the consensus narratives which have been driving markets higher will prove wrong again this year? Time will tell.
Yet, professional investors aren't paid to wait; they're paid to take a view. UniSuper’s Chief Investment Officer, John Pearce, thinks markets are getting it right and that they remain in a good spot. He outlines his positive thesis in an article for Firstlinks this week.
Meanwhile, nabtrade’s Gemma Dale strikes a more cautious note, given the unprecedented rally of seven stocks in the S&P 500. She says history shows narrow market leadership doesn’t usually end well.
James Gruber
Also in this week's edition...
Andrew Fleming from Schroders thinks management guru Peter Drucker’s axiom “culture eats strategy for breakfast” continues to ring true on the ASX. If culture is the sophisticated word for execution, he says building materials company Boral has been a standout over the past 12 months, while its peer Fletcher Building still has a lot of work to do.
Labor's stage 3 tax cuts generated considerable debate among Firstlinks' readers last week. This week, we have a different take on the issue. Tony Dillon argues that if the government was serious about addressing the issue of bracket creep, it would index tax thresholds to inflation.
SMSF expert Meg Heffron expresses her surprise at how rarely she sees ‘spouse contribution splitting’ in SMSFs. This type of splitting is a special rule that effectively allows someone to ‘give’ some of their super contributions to their spouse. Meg looks at how it works in practice, and who it's best suited for.
Lawrence Lam is back with part two of his feature story on Graham Turner's entrepreneurial journey with Flight Centre. Turner tells Lawrence some great tales about how Flight Centre went global, what he's learned from key mistakes, the way he uses psychology to build the right teams, and his criteria for making acquisitions.
Private equity firms aren't shy about touting their superior risk-adjusted returns versus public markets. Empirical research casts doubt on their claims. Larry Swedroe says complexity, capital calls, and illiquidity are among the challenges investors face to reap potential rewards from private equity.
Two extra articles from Morningstar for the weekend. Nathan Zaia asks whether CBA remains overvalued after its earnings report, while Shaun Ler is positive on the turnaround story at AMP.
Lastly, in this week's whitepaper, Neuberger Berman investigates the rise of private credit and what the future may hold for this burgeoning asset class.
***
Weekend market update
On Friday in the US, stocks fell with the Nasdaq showing the largest decline after a hotter-than-expected producer prices report eroded hopes for imminent interest rate cuts by the Federal Reserve. The S&P 500 finished 0.49% lower, while the Nasdaq Composite fell 0.83%. After five consecutive weeks of gains, all major indexes posted a weekly decline. The yield on benchmark US 10-year notes rose 5.3 basis points to 4.293%. Crude oil was 1.49% higher at US$79.19 as Mideast geopolitcal tensions overrode IEA forecasts for lower oil demand.
From AAP Netdesk:
The Australian share market on Friday finished higher for a second day after an bigger-than-expected drop in US retail last month reignited hopes for rate cuts by June. The benchmark S&P/ASX200 index finished Friday up 52.6 points, or 0.69%, to 7,658.3, while the broader All Ordinaries gained 53.9 points, or 0.69%, to 7,905.6. For the week the ASX200 rose 13 points, or 0.18%, despite losing ground Monday through Wednesday.
Eight of the ASX's 11 sectors finished higher, with telecommunications and consumer staples lower and health care flat.
The heavyweight mining sector was the biggest mover, rising 1.5% as BHP added 1% to $45.61, Fortescue climbed 1.1% to $28.40 and Rio Tinto advanced 1.2% to $128.96.
Lithium miners did well after the world's biggest producer, US-headquartered Albermarle, said the current low prices were unsustainable and would need to rise to support long-term demand. Pilbara climbed 7.2%, Liontown rose 11.9%, and IGO added 8.7%.
Commonwealth Bank led its Big Four peers higher, rising 1.9% to $116.28. Westpac climbed 0.8% to $24.57, while ANZ and NAB both added 0.7%, to $28.42 and $33.07, respectively.
Insurers IAG and QBE both fell on their earnings reports, with IAG falling 3.8% to $6.08 and QBE dipping 1.7% to $16.11.
IAG's reported insurance margin was 13.7%, up from 8.5% a year ago but at the bottom end of full-year guidance of 13.5 to 15.5 %.
Inghams fell 12.5% to $3.78 after the poultry producer posted first-half earnings of $253.7 million, up 28.8% from a year ago.
In health care, Neuren Pharmaceutical finished down 14.2% to a two-month low of $19.78 after its shares were placed in a two-hour trading halt so it could respond to a US short sellers' report. Culper Research alleged that Daybue, Neuren's new treatment for a genetic brain disorder called Rett syndrome, had "horrible" discontinuation rates due to adverse side effects, a point Neuren disputed.
Pro Medicus shares dropped 7.2% to $87.24, finishing the week down 18.3% after the health imaging company's earnings results on Thursday.
In tech, Brainchip shares soared 26.3% to a six-month high of 36c, a gain of 60% for the week. The reason for the stellar performance is unclear, although obviously there's enthusiasm for all things AI at the moment.
From Shane Oliver, AMP:
The past week saw another bout of consternation that rate cuts might be delayed after higher-than-expected US inflation. Headline inflation in January fell to 3.1%yoy but core was unchanged at 3.9%yoy. Producer price inflation also came in stronger than expected. The combination of strong economic data and higher than expected inflation and cautious comments from central bankers over the last six weeks have seen market expectations for the start of Fed rate cuts pushed out from March to June and the expected number of rate cuts this year cut from 7 to around 4. Likewise in Australia expectations for the number of rate cuts have been scaled back from nearly 3 to less than 2. However, there is no need to get too concerned.
First, much of the upside surprise in the US CPI was driven by owner’s equivalent rent. Second, the path to lower inflation was always going to be bumpy and the trend in US and global inflation remains down. Third, for those worried about a similar flow on to Australia it’s worth noting that the Australian CPI does not include owners’ equivalent rent as we measure owners’ housing costs via new dwelling purchase costs where price growth peaked a while back. Finally, the volatility around the US CPI and central bank rate cut expectations reflects share and fixed income markets having run a bit ahead of themselves in terms of central bank rate cuts and what we have been seeing is just a normal correction to that.
Our broader view remains that central banks will start to cut from some time in the June quarter led by the ECB and Fed (with five 0.25% cuts each) and then the RBA where we continue to see three cuts this year from around mid-year. And this in turn will likely underpin share markets this year. While January jobs data in Australia was likely distorted by seasonal changes around when people take leave and transition to new jobs, the ongoing fall in job vacancies and hours worked and the rising trend in unemployment and labour underutilisation points to a faster rise in unemployment this year than the RBA is allowing for and is consistent with rate cuts ahead as it will contribute to slower wages growth and downwards pressure on inflation.
Curated by James Gruber and Leisa Bell
Latest updates
PDF version of Firstlinks Newsletter
ASX Listed Bond and Hybrid rate sheet from NAB/nabtrade
Listed Investment Company (LIC) Indicative NTA Report from Bell Potter
Monthly Investment Products update from ASX
Plus updates and announcements on the Sponsor Noticeboard on our website