Register For Our Mailing List

Register to receive our free weekly newsletter including editorials.

Home / 13

An historical (not hysterical) look at gold

Around the world in the last two weeks, people have rushed retail stores to buy physical gold. Perth Mint has reported sales are at their highest level in five years, and they traded over the weekend to cope with demand. People are queuing across Asian cities in panic-like conditions, while the US mint has been forced to cancel sales of its gold coins. Buyers are responding to the rapid price fall to USD1,322 per ounce in mid-April, the lowest level for two years.

What is most extraordinary is that retail investors usually react to rapid market falls in the opposite way. When equity prices drop, investors usually panic from fear it will fall further. Inflows to managed funds are always at their strongest when the market is at its peak, and outflows at their highest when markets bottom. But something else is happening with gold.


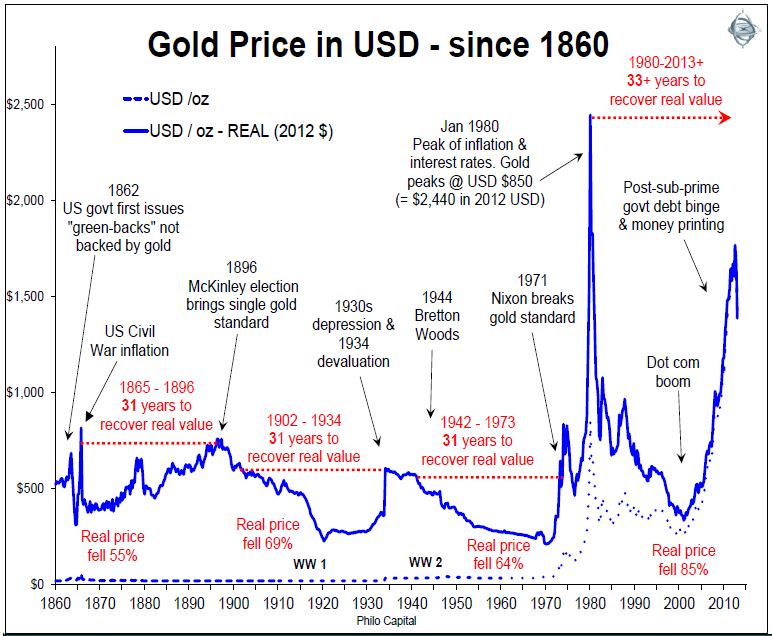
Source: Compiled by Grant Williams of Mauldin Economics from various public sources.

A brief look at gold price history

Most of the time over history, one ounce of gold has been able to buy items worth the equivalent of around USD500 in today’s dollars adjusted for inflation. It has done so for much of the past 2,500 years through many societies. Occasionally the gold price (when measured in paper currencies) surges when paper currencies devalue, but it then falls back again in real terms. If bought below its long run level, gold can provide a hedge against the devaluation of paper, but if bought above the level it is speculation, not ‘investing’. It is not a matter of whether gold represents a store of value or some other safe haven characteristic. For an investor, it is only worth buying when it is cheap.

The gold price reached USD1,900 per ounce on 5 September 2011 in the midst of the US debt ceiling and credit downgrade crises. Since then it has fallen by more than 20%, including a 10% fall on 15 April 2013, triggered by fears that Cyprus and the PIIGS may have to sell their gold reserves to repay debts.

Gold may shoot up to USD4,000 or USD5,000 in one of two scenarios: (a) an extreme left wing outcome resulting in run-away US inflation leading to a breakdown of society; or (b) an extreme right wing scenario with a Tea Party-led Republican government bringing back the gold standard. These scenarios look remote. People who bought gold in the last bubble in 1979-80 are still waiting to get their money back in real terms after inflation 33 years later.

Investors cannot consider gold without also thinking about currencies and inflation, as the three are inextricably linked. Long term holding of gold makes sense as an inflation hedge or as a store of value if bought at or below the long term price around which it has oscillated for thousands of years. However, if paper currencies collapse, the nominal value of gold expressed in paper money terms can rise dramatically. So gold has most appeal if the investor’s home currency is about to experience massive hyper-inflation which destroys the value of paper money, which is unlikely in Australia in the near future. Or since the price of gold is expressed in USD terms, any expected rapid destruction in the value of a home currency may merit purchases of gold.

Of course, profits from short term trading are always possible as a more speculative bet, but long term portfolios are designed to look after long term needs, such as producing income and protecting wealth.

A copy of our comprehensive 2012 study of gold can be found here.


Ashley Owen is Joint CEO of Philo Capital Advisers and a Director of Third Link Investment Managers.


1 Comments
scottb
May 03, 2013

"Investors cannot consider gold without also thinking about currencies and inflation."

Indeed. But in considering inflation, Mr Owen has forgotten that governments purposely and systematically understate the amount of actual inflation so as to make it possible for debtors everywhere – and governments are the greatest of all debtors – to repay obligations in a devalued currency, thereby enabling the ongoing operations of a debt and liquidity-based economy. The U.S government reports inflation at about 2.5% (the basis of Mr Owens analysis), but in fact it's most likely significantly higher...close to 10%. Check out Shadowstats.com.

Adjusted for true inflation, gold peaked in 1980 at about $5,000 which would suggest there's some room to the upside today.

And one can't ignore the size of the monetary base today. A look at the the ratio of the St. Louis Adjusted Monetary Base to the price of gold shows it above 2.0 ...almost record levels. All previous gold 'booms' have only stopped when the ratio falls below 0.22. And we are a very long way from that.

And consider this. In January 1980 when gold peaked at $875, the average price for gold for the month was $669. The monetary base in January 1980 was $132 billion, which means it took only 198 million ounces of gold to cover the monetary base. In January 2012 when gold averaged roughly $1,600, the monetary base was $2,750 billion. Thus it would take 1.7 billion ounces to cover the monetary base. To get the same coverage as in 1980, gold would have to be trading at almost $14,000.

Or maybe you can look at it like this. If the US actually has the 8,133 metric tonnes of gold they claim they have in their reserves (World Gold Council - World Official Gold Holdings) and the US used that gold to back the US monetary base, gold would have to rise $9,745 per ounce. Even backing 40% of the monetary base would see gold at $3,900 an ounce.


Leave a Comment:

RELATED ARTICLES

What do fund managers mean by Quality Investing?

1979 US Government defaults: what happened next?

Nassim Taleb on managing investments for rare events.

banner

Most viewed in recent weeks

2024/25 super thresholds – key changes and implications

The ATO has released all the superannuation rates and thresholds that will apply from 1 July 2024. Here's what’s changing and what’s not, and some key considerations and opportunities in the lead up to 30 June and beyond.

Five months on from cancer diagnosis

Life has radically shifted with my brain cancer, and I don’t know if it will ever be the same again. After decades of writing and a dozen years with Firstlinks, I still want to contribute, but exactly how and when I do that is unclear.

Uncomfortable truths: The real cost of living in retirement

How useful are the retirement savings and spending targets put out by various groups such as ASFA? Not very, and it's reducing the ability of ordinary retirees to fully understand their retirement income options.

Is Australia ready for its population growth over the next decade?

Australia will have 3.7 million more people in a decade's time, though the growth won't be evenly distributed. Over 85s will see the fastest growth, while the number of younger people will barely rise. 

Why LICs may be close to bottoming

Investor disgust, consolidation, de-listings, price discounts, activist investors entering - it’s what typically happens at business cycle troughs, and it’s happening to LICs now. That may present a potential opportunity.

The public servants demanding $3m super tax exemption

The $3 million super tax will capture retired, and soon to retire, public servants and politicians who are members of defined benefit superannuation schemes. Lobbying efforts for exemptions to the tax are intensifying.

Latest Updates

Shares

Exploiting Warren Buffett

Growth investors are using Buffett to justify buying blue chip stocks at almost any price. It’s a recipe for potential disaster, as investors in market darlings like CBA and Cochlear may be about to find out.

Property

Population density trends and what they mean for housing

With Australia’s population moving through the fastest rate of growth since the 1950s, our cities and towns are naturally densifying. This is a look at the latest trends and how they will impact the property market.

SMSF strategies

The ultimate superannuation EOFY checklist 2024

We're nearing the end of the financial year and it's time for SMSFs and other super funds to make the most of the strategies available to them. Here's a 24-point checklist of the most important issues to address.

Shares

The outlook for Nvidia, from a long-time investor

Nvidia has taken the world by storm and is now the third largest stock on the planet - larger than Meta, Amazon, and Alphabet. Here is the latest take on Nvidia from a fund manager who first invested in the company in 2016.

Economy

Gross National Happiness?

Despite being richer, surveyed measures of happiness have been flat to falling in Australia. Some suggest we should focus less on GDP and more on broader measures of wellbeing, though there are pros and cons to that approach.

Shares

The power of dividends

In an era where growth companies dominate and the likes of Nvidia grab all of the attention, dividend paying stocks are flying under the radar. Some of these stocks offer compelling prospective returns.

Fixed interest

The best opportunities in fixed income right now

After more than a decade of pitiful yields, bonds are back offering better prospects for income investors. What are the best ways to take advantage of the market inefficiencies in Australian fixed income?

Sponsors

Alliances

© 2024 Morningstar, Inc. All rights reserved.

Disclaimer
The data, research and opinions provided here are for information purposes; are not an offer to buy or sell a security; and are not warranted to be correct, complete or accurate. Morningstar, its affiliates, and third-party content providers are not responsible for any investment decisions, damages or losses resulting from, or related to, the data and analyses or their use. To the extent any content is general advice, it has been prepared for clients of Morningstar Australasia Pty Ltd (ABN: 95 090 665 544, AFSL: 240892), without reference to your financial objectives, situation or needs. For more information refer to our Financial Services Guide. You should consider the advice in light of these matters and if applicable, the relevant Product Disclosure Statement before making any decision to invest. Past performance does not necessarily indicate a financial product’s future performance. To obtain advice tailored to your situation, contact a professional financial adviser. Articles are current as at date of publication.
This website contains information and opinions provided by third parties. Inclusion of this information does not necessarily represent Morningstar’s positions, strategies or opinions and should not be considered an endorsement by Morningstar.